Comparing Rates of Fermentation in Yeast
Learning Objectives
After completing the lab, the student will be able to:
- Describe how different carbon compounds affect the rate of fermentation.
- Describe how temperature affects the rate of fermentation.
Introduction
Several approaches to metabolizing energy exist at the cellular/biochemical level. Organisms can metabolize energy by aerobic respiration, anaerobic respiration, and/or fermentation. Yeast carry out fermentation as a means to access the chemical energy from their food. In this activity, you will be comparing fermentation between different food sources and a control group of water. Yeast can exist in a state of dormancy, where they are alive, but their physical activity has temporarily stopped to minimize energy use. This adaptation allows these organisms to survive extended periods of drought and other harsh environmental conditions. As you add water to the dry yeast, you will be activating the cells out of dormancy, and they will resume physical activity and begin consuming energy. Once the yeast absorbs the food molecule, it will first break the molecule down in a process called glycolysis. The word glycolysis literally translates into the breaking apart of glucose and this is the first step of the metabolism of sugars (Figure 9.1).
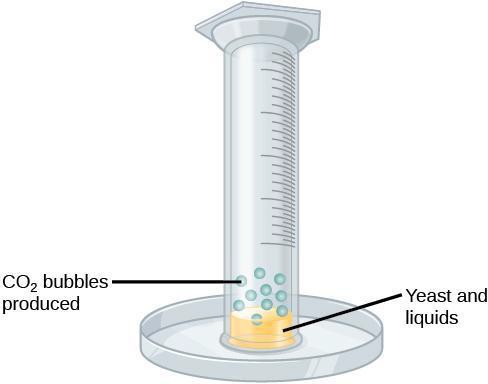
Shortly after mixing the activated yeast with the food/sugar molecules, fermentation will begin, and you will be able to observe gas bubbles being produced. This gas is carbon dioxide, one of the products of fermentation.

Safety Precautions
- Use care when using glassware.
- Be careful when inverting the graduated cylinder into Petri dish.
- Inform your teacher immediately of any broken or cracked glassware, as it could cause injuries.
- Clean up any spilled liquids to prevent people from slipping.
Materials:
- Graduated cylinder (50 ml)
- Petri dishes
- Beaker/container for yeast solution (150–200 ml)
- One package of dry yeast
- Warm water
- Room temperature water
- Glucose
- A sugar substitute
- Pipette or droppers
- Paraffin wax paper
- Paper towels
For this activity, you will work in pairs.
Procedure
Step 1: Warm 100ml of tap water slightly on a hot plate (warm not hot). Add the yeast packet to the beaker; the warm water will activate the yeast (bring it out of dormancy). Swirl slightly until water and yeast are mixed. Allow 10 minutes for activation. During this time, create a data table to measure the volume in milliliters of the carbon dioxide gas bubbles as a function of time. Include rows for water, 5% glucose, 5% sucrose (table sugar) and 5% sugar substitute, and columns for four different times. Which of these is serving as the control? Progress to Step 2 while the yeast activates.
Step 2: Prepare 5% solutions of glucose, sucrose, and sugar substitute. Make 100 ml of each. Describe the steps for each in your lab notebook. List the brand and ingredients in the sugar substitute.
Step 3: Identify four 50 ml graduated cylinders that will stand upside down in a petri dish, without falling over. Wash them with soap, and rinse well. Cut a square piece of wax paper (2-3″ each side). Practice filling the cylinder with water to an inch or so from the top, placing the wax paper over the opening, and inverting it into the petri dish with minimal leakage. Verify that the top of the inverted water column is in a position that it can be measured using the markings on the cylinder. See Figure 9.2.
Step 4: You will now start with the first trial (yeast and water) of measuring carbon dioxide gas bubbles produced from fermentation. Ready a watch that records seconds (don’t use a stopwatch, because you will need to time four different tests at once). Pour 15 ml of yeast solution into the graduated cylinder. Then add 10 ml of tap water, and swirl. Then top up with more tap water to the height you determined in Step 2 above. Invert, and record the time including seconds.
Step 5: Repeat Step 3 for the 5% glucose, 5% sucrose, and 5% sugar substitutes. In each case, use 15 ml of yeast solution, and 10 ml of the glucose/sucrose/sugar substitute, top up the cylinder and invert, and record the start time.
Step 6: After a time (it may take 10’s of minutes) a layer of froth (from rising bubbles) will start to accumulate at the top of the water column in the inverted cylinders. Record its thickness in ml at times of 15, 30, 45, and 60 min.
Discussion
Did glucose, sucrose, or the sugar substitute produce the most fermentation? Explain how your control results served to confirm that the frothing was indeed due to fermentation and not some other unaccounted for process of the yeast reacting to the water rather than the food.
