Influence of the Light Reaction on the Concentration of CO2
Learning Objectives
After completing the lab, the student will be able to:
- Measure the dependence of CO2 fixation on the light-dependent reaction;
- Understand how to measure photosynthesis based on both consumption of carbon dioxide.
Introduction
In this experiment, you will predict and test the effect of environmental conditions on the process of photosynthesis. Gaseous carbon dioxide dissolves in water per the reaction
CO2 + H2O↔ H2CO3 ↔ H+ + HCO3–
Carbon dioxide and water combine to generate the unstable carbonic acid molecule that separates into hydrogen and bicarbonate ions effectively lowering the pH of the solution. The reaction is reversible. When CO2 molecules are consumed by photosynthesis, the reaction shifts to the left. Hydrogen ions and bicarbonate ions combine to replace CO2 with the net effect of increasing the pH of the solution.
A pH indicator is a chemical compound that changes color based on pH level. In this experiment, you will use phenol red, which appears yellow at pH below 7, orange at neutral pH, and bright red or pink at basic pH values (see Figure 11.1).
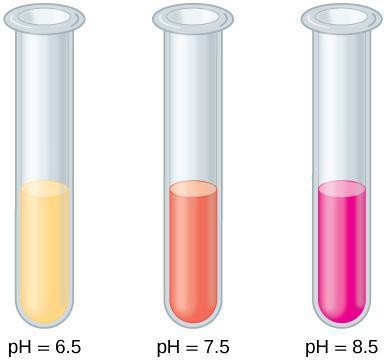
Figure 11.1: The pH indicator phenol red appears yellow at an acidic pH, pinkish orange at a neutral pH, and bright red or pink at a basic pH.
Safety Precautions
- Be careful when blowing into the straw inside the reaction vessels. Do not suck up the solution.
- Do not touch incandescent lamps, because they can be very hot.
- Wear aprons and eye protection.
Materials
- Plant material: Elodea or other aquatic plant
- Flasks
- Transfer pipettes
- Solution of phenol red
- pH meter
- New drinking straws
- Test tubes and test tube racks
- Lamps with LED bulbs
- Beakers of water
- Meter stick
For this activity, you will work in pairs.
Procedure
Changing pH of water by adding CO2
Step 1: Fill a beaker up to 100 ml with tap water. Add 10 drops of phenol red. Describe the color in your lab notebook. Also measure it with a pH meter, and enter it into your notebook.
Step 2: Blow into the beaker using a straw (be careful not to ingest). Your exhaled air contains carbon dioxide, which will dissolve in the water of the phenol solution and created carbonic acid, liberating H+ ions into the solution. Describe the color change of the phenol red solution. Based on the colors in Figure 11.1, what was the change in pH? Measure the pH using the meter. How much of a change in H+ ion concentration did the change in the meter reading, represent?
Measuring carbon fixation during photosynthesis, using consumption of CO2
Step 1: Place a fresh sprig of Elodea, approximately half as long as a test tube, into a test tube. Gently push it to the bottom. Add the phenol red solution, enough so that 1.5″ extends above the end of the Elodea sprig. Also add phenol red solution to an empty test tube, to the same depth. Place them side by side in a rack, and shine two LED lamps on them from opposite sides, from approximately one foot away. As the Elodea sprig photosynthesizes using the light from the LED lamps, it will consume carbon dioxide (which is an input reagent in photosynthesis). Because the CO2 makes carbonic acid in the water, the plant’s consumption of it will progressively reduce the amount of carbonic acid in the solution, resulting in less H+ and increased pH.
Step 2: Immerse the bulb (wand tip) of the pH meter into the Elodea tube, using a clothespin to keep it above the sprig (not pressing against it). Allow the pH reading to stabilize, and record it in your lab notebook.
Step 3: Record the pH at 15 minute intervals for 2.0 hours. Enter these into your lab notebook, and then draw a graph showing pH (vertical) at each 15 minute time (horizontal) for both the Elodea tube and the other tube (control). Connect the dots by a line. Explain any differences between the pH change between the Elodea and control tubes.
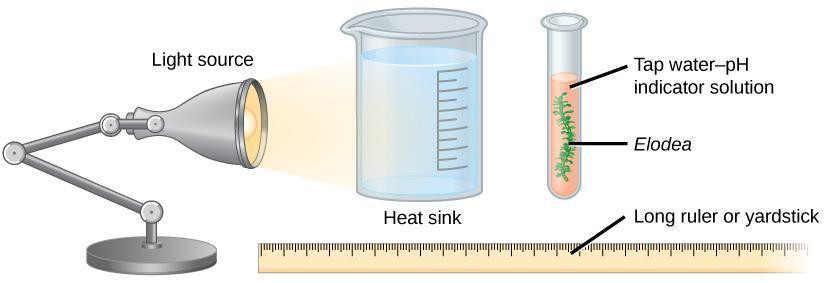
Figure 11.2: Experimental setup. The Heat sink beaker is only needed if the lamp is not LED (whereupon it is used to absorb the lamp’s heat).
Discussion
- Scientists report that the levels of carbon dioxide are rising in the atmosphere and driving climate change. Another observation is that acidification of oceans is also a consequence of climate change. Can you explain what link may exist between the two phenomena and how it affects the marine ecosystem? Record in your lab notebook.
