Measuring the Enzymatic Activity of Lactase
Learning Objectives
After completing the lab, the student will be able to:
- Measure enzymatic activity of the enzyme lactase over time and represent it graphically.
Introduction
Enzymes catalyze reactions inside living organisms, and are fundamentally important to the biochemical processes of life. Some of their activity is related to metabolizing food energy, including the breakdown of larger molecules into simple carbohydrates. Enzymes are very specific in their roles, and are configured (shaped) to carry out very specific reactions. For instance, lactase specifically breaks down lactose into its constituent simple sugars, galactose and glucose. Although glucose is also found in sucrose, it is there bound with fructose, and thus sucrose resists being broken down by lactose. Lactose is famously found in milk and other dairy products (Figure 7.1).
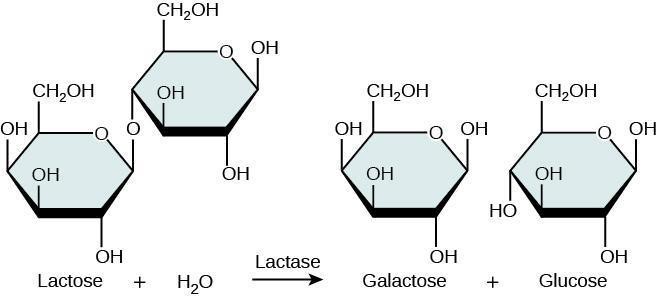
Glucose, one of the products of lactose degradation, can be detected using glucose detection strips, which change color in response to exposure to different glucose concentrations.
Safety Precautions
- Goggles should be worn at all times while in laboratory
- No open toe shoes worn in laboratory
- Measure fluids carefully using graduated cylinders to avoid breakage and spillage.
- Inform your teacher immediately of any broken glassware as it could cause injuries.
- Clean up any spilled fluids to prevent other people from slipping.
Materials
- Graduated cylinder
- Beaker
- Water
- Milk
- Lactase powder
- Stirring rod
- Glucose (powdered)
- Balance
- Labeling pencil
- Glucose test strips
- Timer
For this activity you will work in pairs.
Procedure
Step 1: Make 100 mL of a 20 mg/mL glucose solution. In your lab notebook, list the steps by which you calculate how much glucose powder to weigh, and how to what volume to fill up the beaker. Set up tubes as follows:
- Negative control: 3 mL of tap water
- Positive control: 3 mL of 20 mg/mL glucose solution
Insert a glucose test strip into each tube for 2 seconds, and compare the color you observe after exactly 3 minutes to the color chart that comes with the test strips. The color will continue to change, so it is important to take your reading at the 3 min mark. What is the concentration of glucose in each tube?
Step 2: Prepare two small beakers each containing 2 mL of milk. The beaker should be small/short enough that you can dip the glucose test strip into the liquid at the bottom. Additionally, make 50 ml of lactase enzyme solution, at the same concentration as your glucose in the previous step (20 mg/mL). In your lab notebook, show your calculations to reduce the amount from 100 ml (as used for the glucose) to 50 ml, while keeping the same concentration.
Step 3: Your experiment should last for 15 minutes, during which time the lactase will progressively break apart the lactose in the milk, so that the glucose level gradually increases. Create a data table to record glucose concentrations in each of the two tubes of milk at 3-minute intervals. Recall that though you will dip the glucose test strip into each solution at 3 minute intervals, the strips will not be readable immediately- you need to wait 6 minutes before observing the color and deducing the corresponding glucose concentration (note that this is different from the previous exercise- we will observe after 6 minutes for milk, not 3 minutes as in glucose). To keep things straight, use a stopwatch, and start it running when you dip your first strips. On your chart, write down the times at which each observation will be made, so that you don’t miss any of them.
Step 4: To start the experiment, add 1 mL of water to one of the tubes of milk and 1 mL of the lactase solution to the other.
Step 5: Answer in your notebook: Did any glucose appear in the water sample? At what time (if any) did the glucose concentration stop increasing? Why might it stop increasing?
