Exhibit 1.1 (Credit: Marco Verch /flickr / Attribution 2.0 Generic (CC BY 2.0))
Learning Objectives
After reading this chapter, you should be able to answer these questions:
How do businesses and not-for-profit organizations help create our standard of living?
What are the sectors of the business environment, and how do changes in them influence business decisions?
What are the primary features of the world’s economic systems, and how are the three sectors of the U.S. economy linked?
How do economic growth, full employment, price stability, and inflation indicate a nation’s economic health?
How does the government use monetary policy and fiscal policy to achieve its macroeconomic goals?
What are the basic microeconomic concepts of demand and supply, and how do they establish prices?
What are the four types of market structure?
Which trends are reshaping the business, microeconomic, and macroeconomic environments and competitive arena?
Exploring Business Careers
Team Rubicon: Disaster Relief and a Sense of Purpose
Accounting for a substantial amount of economic activity in the United States, not-for-profits are an undeniable force in the business world, even though their focus on goals other than profit falls outside the traditional model of a for-profit business. But it is this shift away from a focus on profit that allows them to pursue missions of social improvement and contributions to society as a whole. To be truly effective in a not-for-profit organization, a person must share the organization’s vision.
The vision for Team Rubicon was shaped by its cofounders, Jake Wood and William McNulty, who saw the devastation caused by the Haiti earthquake in 2010 and sprang into action. Both marines, Wood and McNulty knew they could do something to help in this devastating and chaotic situation. Within 24 hours, they enlisted the help of six other military veterans and first responders, gathered donations and supplies from friends and family, and made their way to Haiti to help with disaster relief, and Team Rubicon was born.
Exhibit 1.2 Team Rubicon (Credit: Bureau of Land Management Oregon and Washington/flickr/ Attribution 2.0 Generic (CC BY 2.0))
The organization gets its name from the Rubicon, a river in northern Italy that Julius Caesar and his troops crossed on their epic march to Rome, with the river marking the point of no return. The name underscores the cofounders’ experiences during the Haitian disaster, where despite advice from government officials and other aid organizations not to proceed, their small team crossed into Haiti from the Dominican Republic carrying crucial gear and medical supplies to thousands of earthquake victims.
Seven years later, Team Rubicon’s mission is twofold: to pair the skills and experiences of military veterans with first responders to hit the ground running in any type of disaster and to provide a sense of community and accomplishment to veterans who have served their country proudly but may be struggling as a result of their war experiences.
According to the organization’s mission statement, Team Rubicon seeks to provide veterans with three things they sometimes lose after leaving the military: a purpose, gained through disaster relief; a sense of community, built by serving with others; and a feeling of self-worth from recognizing the impact one individual can make when dealing with natural disasters.
Headquartered in the Los Angeles area, Team Rubicon is staffed by more than 60 employees who work in 10 regions around the country, along with more than 40,000 volunteers ready to deploy within 24 hours. Similar to company operations in for-profit organizations, staff positions at Team Rubicon include regional administrators; field operations (including membership and training); marketing, communications, and social media; fundraising and partnership development; finance and accounting; and people operations.
Team Rubicon’s staff members bring professional and/or military experience to their daily jobs, but they all share the organization’s vision. Many staff members started as volunteers for Team Rubicon while working in for-profit careers, while others took advantage of the organization’s strong internship program to become familiar with its mission and focus on disaster relief.
In 2016, Team Rubicon trained 8,000 military veterans and first responders in disaster relief and responded to 46 disasters, which required more than 85,000 volunteer hours. In addition to donations from individuals and corporations, Team Rubicon relies on its partnerships with other organizations, such as Southwest Airlines, which supplies hundreds of free plane tickets each year to fly volunteers to disaster sites.
Team Rubicon actively engages its nationwide community at every level of the organization, from volunteer to board member, and every step of its operation: from training to planning to implementation to seeking donations and volunteers to help with any type of disaster relief. Over the past several years, Team Rubicon has been recognized as one of the top nonprofits to work for by The NonProfit Times, based on employee surveys and business partners’ input about the organization’s work environment.
The not-for-profit world may not be for everyone, but if its growth is any indication within the overall economy, it does appeal to many. With a resolve to assist those in need, including both disaster victims and returning military personnel, Team Rubicon offers opportunities for those interested in nonprofit careers as well as those passionate about helping others.
Sources: Company website, “Our Mission” and “Staff & Board,” https://teamrubiconusa.org, accessed May 29, 2017; Mark Hrywna, “2017 NPT Best Nonprofits to Work,” The NonProfit Times, http://thenonprofittimes.com, accessed May 27, 2017; Mark Hrywna, “2016 NPT Best Nonprofits to Work,” The NonProfit Times, http://thenonprofittimes.com, accessed May 27, 2017; Kyle Dickman, “The Future of Disaster Relief Isn’t the Red Cross,” Outside, https://www.outsideonline.com, August 25, 2016.
This module provides the basic structures upon which the business world is built: how it is organized, what outside forces influence it, and where it is heading. It also explores how the world’s economies and governments shape economic activity. Each day in the United States, thousands of new businesses are born. Only a rare few will become the next Apple, Google, or Amazon. Unfortunately, many others will never see their first anniversary. The survivors are those that understand that change is the one constant in the business environment. Those organizations pay attention to the business environment in which they operate and the trends that affect all businesses and then successfully adapt to those trends. In this module, we will meet many businesses, both large and small, profit and not-for-profit, that prosper because they track trends and use them to identify potential opportunities. This ability to manage change is a critical factor in separating the success stories from the tales of business failure.
We begin our study of business by introducing you to the primary functions of a business, the relationship between risk and profits, and the importance of not-for-profit organizations. We’ll also examine the major components of the business environment and how changing demographic, social, political and legal, and competitive factors affect all business organizations. Next, we’ll explore how economies provide jobs for workers and also compete with other businesses to create and deliver products to consumers. You will also learn how governments attempt to influence economic activity through policies such as lowering or raising taxes. Next, we discuss how supply and demand determine prices for goods and services. Finally, we conclude by examining key trends in the business environment, economic systems, and the competitive environment.
1.1 The Nature of Business
Learning Objectives
How do businesses and not-for-profit organizations help create our standard of living?
Take a moment to think about the many different types of businesses you come into contact with on a typical day. As you drive to class, you may stop at a gas station that is part of a major national oil company and grab lunch from a fast food chain such as Taco Bell or McDonald’s or the neighborhood pizza place. Need more cash? You can do your banking on a smartphone or other device via mobile apps. You don’t even have to visit the store anymore: online shopping brings the stores to you, offering everything from clothes to food, furniture, and concert tickets.
A business is an organization that strives for a profit by providing goods and services desired by its customers. Businesses meet the needs of consumers by providing medical care, autos, and countless other goods and services. Goods are tangible items manufactured by businesses, such as laptops. Services are intangible offerings of businesses that can’t be held, touched, or stored. Physicians, lawyers, hairstylists, car washes, and airlines all provide services. Businesses also serve other organizations, such as hospitals, retailers, and governments, by providing machinery, goods for resale, computers, and thousands of other items.
Thus, businesses create the goods and services that are the basis of our standard of living. The standard of living of any country is measured by the output of goods and services people can buy with the money they have. The United States has one of the highest standards of living in the world. Although several countries, such as Switzerland and Germany, have higher average wages than the United States, their standards of living aren’t higher, because prices are so much higher. As a result, the same amount of money buys less in those countries. For example, in the United States, we can buy an Extra Value Meal at McDonald’s for less than $5, while in another country, a similar meal might cost as much as $10.
Businesses play a key role in determining our quality of life by providing jobs and goods and services to society. Quality of life refers to the general level of human happiness based on such things as life expectancy, educational standards, health, sanitation, and leisure time. Building a high quality of life is a combined effort of businesses, government, and not-for-profit organizations. In 2017, Vienna, Austria, ranked highest in quality of life, followed by Zurich, Switzerland; Auckland, New Zealand; and Munich, Germany. It may come as a surprise that not one of the world’s top cities is in the United States: seven of the top 10 locations are in western Europe, two are in Australia/New Zealand, and one is in Canada. At the other end of the scale, Baghdad, Iraq, is the city scoring the lowest on the annual survey.1Creating a quality of life is not without risks, however. Risk is the potential to lose time and money or otherwise not be able to accomplish an organization’s goals. Without enough blood donors, for example, the American Red Cross faces the risk of not meeting the demand for blood by victims of disaster. Businesses such as Microsoft face the risk of falling short of their revenue and profit goals. Revenue is the money a company receives by providing services or selling goods to customers. Costs are expenses for rent, salaries, supplies, transportation, and many other items that a company incurs from creating and selling goods and services. For example, some of the costs incurred by Microsoft in developing its software include expenses for salaries, facilities, and advertising. If Microsoft has money left over after it pays all costs, it has a profit. A company whose costs are greater than revenues shows a loss.
When a company such as Microsoft uses its resources intelligently, it can often increase sales, hold costs down, and earn a profit. Not all companies earn profits, but that is the risk of being in business. In U.S. business today, there is generally a direct relationship between risks and profit: the greater the risks, the greater the potential for profit (or loss). Companies that take too conservative a stance may lose out to more nimble competitors who react quickly to the changing business environment.
Take Sony, for example. The Japanese electronics giant, once a leader with its Walkman music player and Trinitron televisions, steadily lost ground—and profits—over the past two decades to other companies by not embracing new technologies such as the digital music format and flat-panel TV screens. Sony misjudged what the market wanted and stayed with proprietary technologies rather than create cross-platform options for consumers. Apple, at the time an upstart in personal music devices, quickly grabbed the lion’s share of the digital music market with its iPods and iTunes music streaming service. By 2016, Sony restructured its business portfolio and experienced substantial success with its PlayStation 4 gaming console and original gaming content.
Not-for-Profit Organizations
Not all organizations strive to make a profit. A not-for-profit organization is an organization that exists to achieve some goal other than the usual business goal of profit. Charities such as Habitat for Humanity, the United Way, the American Cancer Society, and the World Wildlife Fund are not-for-profit organizations, as are most hospitals, zoos, arts organizations, civic groups, and religious organizations. Over the last 20 years, the number of nonprofit organizations—and the employees and volunteers who work for them—has increased considerably. The government is our largest and most pervasive not-for-profit group. In addition, more than 1.5 million nongovernmental not-for-profit entities operate in the United States today and contribute more than $900 billion annually to the U.S. economy.
Like their for-profit counterparts, these groups set goals and require resources to meet those goals. However, their goals are not focused on profits. For example, a not-for-profit organization’s goal might be feeding the poor, preserving the environment, increasing attendance at the ballet, or preventing drunk driving. Not-for-profit organizations do not compete directly with one another in the same manner as, for example, Ford and Honda, but they do compete for talented employees, people’s limited volunteer time, and donations.
Exhibit 1.3 Rescue boat Following Hurricane Irma affected The island of Puerto Rico, the Kentucky and Hawaii National Guard assisted storm victims by donating to disaster relief efforts. Some not-for-profit charities focused aid toward the people of the region, but others delivered care to a different group of sufferers: animals and pets. Although most animal hospitals are not normally a refuge for displaced animals, many facilities opened their doors to pet owners affected by the torrential rains. Why are tasks such as animal rescue managed primarily through not-for-profit organizations? (Credit: Hawaii and Kentucky National Guard /flickr /Attribution 2.0 Generic (CC BY))
The boundaries that formerly separated not-for-profit and for-profit organizations have blurred, leading to a greater exchange of ideas between the sectors. As discussed in detail in the ethics chapter, for-profit businesses are now addressing social issues. Successful not-for-profits apply business principles to operate more effectively. Not-for-profit managers are concerned with the same concepts as their colleagues in for-profit companies: developing strategy, budgeting carefully, measuring performance, encouraging innovation, improving productivity, demonstrating accountability, and fostering an ethical workplace environment.
In addition to pursuing a museum’s artistic goals, for example, top executives manage the administrative and business side of the organization: human resources, finance, and legal concerns. Ticket revenues cover a fraction of the museum’s operating costs, so the director spends a great deal of time seeking major donations and memberships. Today’s museum boards of directors include both art patrons and business executives who want to see sound fiscal decision-making in a not-for-profit setting. Therefore, a museum director must walk a fine line between the institution’s artistic mission and financial policies. According to a survey by The Economist, over the next several years, major art museums will be looking for new directors, as more than a third of the current ones are approaching retirement.
Factors of Production: The Building Blocks of Business
To provide goods and services, regardless of whether they operate in the for-profit or not-for-profit sector, organizations require inputs in the form of resources called actors of production. Four traditional factors of production are common to all productive activity: natural resources, labor (human resources), capital, and entrepreneurship. Many experts now include knowledge as a fifth factor, acknowledging its key role in business success. By using the factors of production efficiently, a company can produce more goods and services with the same resources.
Commodities that are useful inputs in their natural state are known as natural resources. They include farmland, forests, mineral and oil deposits, and water. Sometimes natural resources are simply called land, although, as you can see, the term means more than just land. Companies use natural resources in different ways. International Paper Company uses wood pulp to make paper, and Pacific Gas & Electric Company may use water, oil, or coal to produce electricity. Today, urban sprawl, pollution, and limited resources have raised questions about resource use. Conservationists, environmentalists, and government bodies are proposing laws to require land-use planning and resource conservation.
Labor, or human resources, refers to the economic contributions of people working with their minds and muscles. This input includes the talents of everyone—from a restaurant cook to a nuclear physicist—who performs the many tasks of manufacturing and selling goods and services.
The tools, machinery, equipment, and buildings used to produce goods and services and get them to the consumer are known as capital. Sometimes the term capital is also used to mean the money that buys machinery, factories, and other production and distribution facilities. However, because money itself produces nothing, it is not one of the basic inputs. Instead, it is a means of acquiring the inputs. Therefore, in this context, capital does not include money.
Entrepreneurs are the people who combine the inputs of natural resources, labor, and capital to produce goods or services with the intention of making a profit or accomplishing a not-for-profit goal. These people make the decisions that set the course for their businesses; they create products and production processes or develop services. Because they are not guaranteed a profit in return for their time and effort, they must be risk-takers. Of course, if their companies succeed, the rewards may be great.
Today, many individuals want to start their own businesses. They are attracted by the opportunity to be their own boss and reap the financial rewards of a successful firm. Many start their first business from their dorm rooms, such as Mark Zuckerberg of Facebook, or while living at home, so their cost is almost zero.
Entrepreneurs include people such as Microsoft cofounder Bill Gates, who was named the richest person in the world in 2017, as well as Google founders Sergey Brin and Larry Page. Many thousands of individuals have started companies that, while remaining small, make a major contribution to the U.S. economy.
Catching the Entrepreneurial Spirit
StickerGiant Embraces Change
Entrepreneurs typically are not afraid to take risks or change the way they do business if it means there is a better path to success. John Fischer of Longmont, Colorado, fits the profile.
The drawn-out U.S. presidential election in 2000 between Bush and Gore inspired Fischer to create a bumper sticker that claimed, “He’s Not My President,” which became a top seller. As a result of this venture, Fischer started an online retail sticker store, which he viewed as possibly the “Amazon of Stickers.” Designing and making stickers in his basement, Fischer’s start-up would eventually become a multimillion-dollar company, recognized in 2017 by Forbes as one of its top 25 small businesses.
The StickerGiant online store was successful, supplying everything from sports stickers to ones commemorating rock and roll bands and breweries. By 2011, the business was going strong; however, the entrepreneur decided to do away with the retail store, instead focusing the business on custom orders, which became StickerGiant’s main product.
As the company became more successful and added more employees, Fischer once again looked to make some changes. In 2012 he decided to introduce a concept called open-book management, in which he shares the company’s financials with employees at a weekly meeting. Other topics discussed at the meeting include customer comments and feedback, employee concerns, and colleague appreciation for one another. Fischer believes sharing information about the company’s performance (good or bad) not only allows employees to feel part of the operation, but also empowers them to embrace change or suggest ideas that could help the business expand and flourish.
Innovation is also visible in the technology StickerGiant uses to create miles and miles of custom stickers (nearly 800 miles of stickers in 2016). The manufacturing process involves digital printing and laser-finishing equipment. Fischer says only five other companies worldwide have the laser-finishing equipment StickerGiant uses as part of its operations. Because of the investment in this high-tech equipment, the company can make custom stickers in large quantities overnight and ship them to customers the next day.
This small business continues to evolve with an entrepreneur at the helm who is not afraid of making changes or having fun. In 2016, StickerGiant put together Saul the Sticker Ball, a Guinness World Records winner that weighed in at a whopping 232 pounds. Fischer and his employees created Saul when they collected more than 170,000 stickers that had been lying around the office and decided to put them to good use. With $10 million in annual sales and nearly 40 employees, StickerGiant continues to be a successful endeavor for John Fischer and his employees almost two decades after Fischer created his first sticker.
Questions for Discussion
How does being a risk-taker help Fischer in his business activities?
If you were a small business owner, would you consider sharing the company’s financial data with employees? Explain your reasoning.
Sources: “All About StickerGiant,” https://www.stickergiant.com, accessed May 29, 2017; Bo Burlingham, “Forbes Small Giants 2017: America’s Best Small Companies,” Forbes, http://www.forbes.com, May 9, 2017; Karsten Strauss, “Making Money and Breaking Records in the Sticker Business,” Forbes, http://www.forbes.com, January 26, 2016; Emilie Rusch, “StickerGiant Does Big Business in Tiny Town of Hygiene,” Denver Post, April 19, 2016, http://www.denverpost.com; Eric Peterson, “StickerGiant,” Company Week, https://companyweek.com, September 5, 2016.
A number of outstanding managers and noted academics are beginning to emphasize a fifth factor of production—knowledge. Knowledge refers to the combined talents and skills of the workforce and has become a primary driver of economic growth. Today’s competitive environment places a premium on knowledge and learning over physical resources. Recent statistics suggest that the number of U.S. knowledge workers has doubled over the last 30 years, with an estimated 2 million knowledge job openings annually. Despite the fact that many “routine” jobs have been replaced by automation over the last decade or outsourced to other countries, technology has actually created more jobs that require knowledge and cognitive skills.
Concept Check
Explain the concepts of revenue, costs, and profit.
What are the five factors of production?
What is the role of an entrepreneur in society?
1.2 Understanding the Business Environment
Learning Objectives
What are the sectors of the business environment, and how do changes in them influence business decisions?
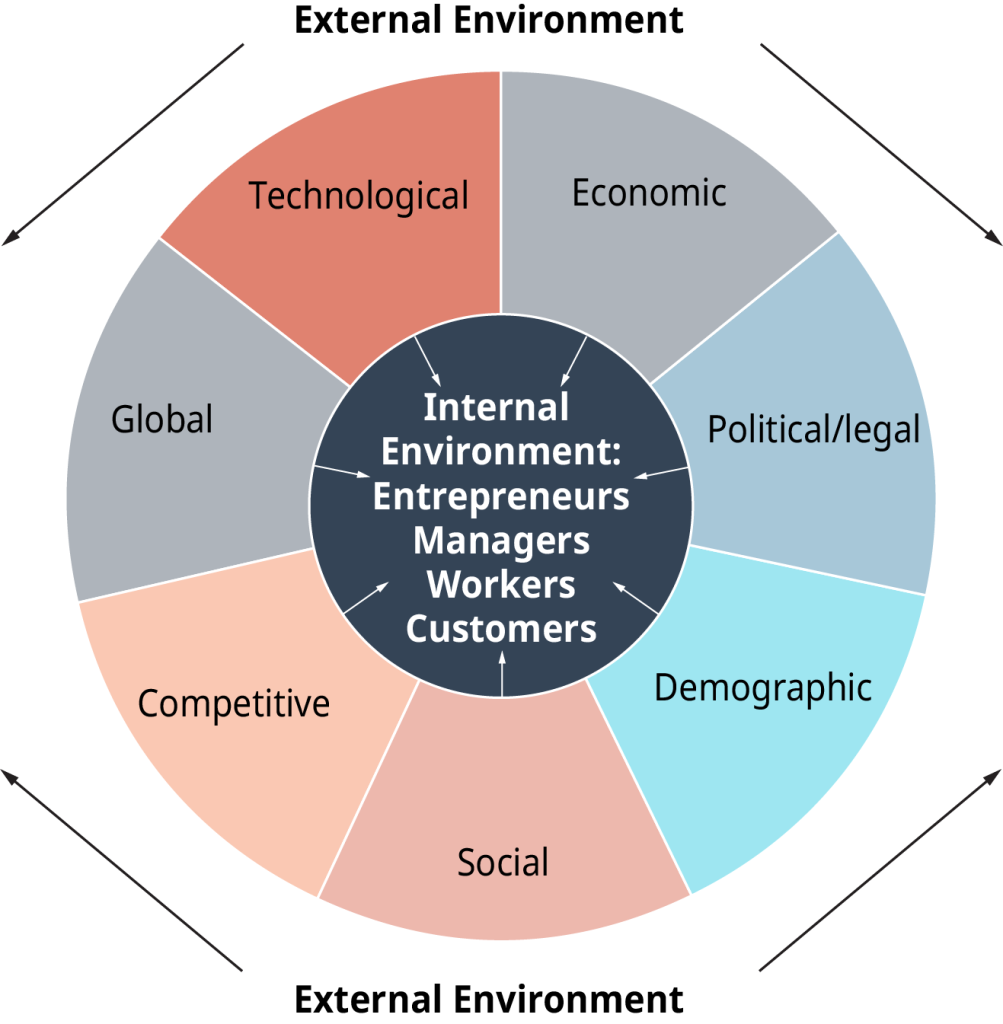
Businesses do not operate in a vacuum but rather in a dynamic environment that has a direct influence on how they operate and whether they will achieve their objectives. This external business environment is composed of numerous outside organizations and forces that we can group into seven key sub-environments, as Exhibit 1.4 illustrates: economic, political and legal, demographic, social, competitive, global, and technological. Each of these sectors creates a unique set of challenges and opportunities for businesses.
Business owners and managers have a great deal of control over the internal environment of business, which covers day-to-day decisions. They choose the supplies they purchase, which employees they hire, the products they sell, and where they sell those products. They use their skills and resources to create goods and services that will satisfy existing and prospective customers. However, the external environmental conditions that affect a business are generally beyond the control of management and change constantly. To compete successfully, business owners and managers must continuously study the environment and adapt their businesses accordingly.
Other forces, such as natural disasters, can also have a major impact on businesses. While still in the rebuilding stage after Hurricane Katrina hit in 2005, the U.S. Gulf Coast suffered another disaster in April 2010 as a result of an explosion on the Deepwater Horizon oil-rig, which killed 11 workers and sent more than 3 million barrels of oil into the Gulf of Mexico. This event, which played out for more than 87 days, severely affected the environment, businesses, tourism, and people’s livelihoods. Global oil conglomerate BP, which was responsible for the oil spill, has spent more than $60 billion in response to the disaster and cleanup. Seven years after the explosion, tourism and other businesses are slowly recovering, although scientists are not certain about the long-term environmental consequences of the oil spill.[1]
Exhibit 1.4 The Dynamic Business Environment (Attribution: Copyright Rice University, OpenStax, under CC-BY 4.0 license)
No one business is large or powerful enough to create major changes in the external environment. Thus, managers are primarily adapters to, rather than agents of, change. Global competition is basically an uncontrollable element in the external environment. In some situations, however, a firm can influence external events through its strategies. For example, major U.S. pharmaceutical companies have been successful in getting the Food and Drug Administration (FDA) to speed up the approval process for new drugs.8 In recent years, the five largest companies in the S&P Index—Google, Facebook, Amazon, Microsoft, and Apple—have spent close to $50 million on lobbying activities in the nation’s capital in an effort to help policy makers understand the tech industry and the importance of innovation and an “open” internet.9 Let’s now take a brief look at these varied environmental influences.
Economic Influences
This category is one of the most important external influences on businesses. Fluctuations in the level of economic activity create business cycles that affect businesses and individuals in many ways. When the economy is growing, for example, unemployment rates are low, and income levels rise. Inflation and interest rates are other areas that change according to economic activity. Through the policies it sets, such as taxes and interest rate levels, a government attempts to stimulate or curtail the level of economic activity. In addition, the forces of supply and demand determine how prices and quantities of goods and services behave in a free market.
Political and Legal Influences
The political climate of a country is another critical factor for managers to consider in day-to-day business operations. The amount of government activity, the types of laws it passes, and the general political stability of a government are three components of political climate. For example, a multinational company such as General Electric will evaluate the political climate of a country before deciding to locate a plant there. Is the government stable, or might a coup disrupt the country? How restrictive are the regulations for foreign businesses, including foreign ownership of business property and taxation? Import tariffs, quotas, and export restrictions also must be taken into account.
In the United States, laws passed by Congress and the many regulatory agencies cover such areas as competition, minimum wages, environmental protection, worker safety, and copyrights and patents. For example, Congress passed the Telecommunications Act of 1996 to deregulate the telecommunications industry. As a result, competition increased and new opportunities arose as traditional boundaries between service providers blurred. Today the dramatic growth in mobile technology has changed the focus of telecommunications, which now faces challenges related to broadband access and speed, content streaming, and much-needed improvements in network infrastructure to address ever-increasing data transmissions.
Federal agencies play a significant role in business operations. When Pfizer wants to bring a new medication for heart disease to market, it must follow the procedures set by the Food and Drug Administration for testing and clinical trials and secure FDA approval. Before issuing stock, Pfizer must register the securities with the Securities and Exchange Commission. The Federal Trade Commission will penalize Pfizer if its advertisements promoting the drug’s benefits are misleading. These are just a few ways the political and legal environments affect business decisions.
State and local governments also exert control over businesses—imposing taxes, issuing corporate charters and business licenses, setting zoning ordinances, and similar regulations. We discuss the legal environment in greater detail in a separate appendix.
Demographic Factors
Demographic factors are uncontrollable in the business environment and extremely important to managers. Demography is the study of people’s vital statistics, such as their age, gender, race and ethnicity, and location. Demographics help companies define the markets for their products and also determine the size and composition of the workforce. You’ll encounter demographics as you continue your study of business.
Demographics are at the heart of many business decisions. Businesses today must deal with the unique shopping preferences of different generations, which each require marketing approaches and goods and services targeted to their needs. For example, more than 75 million members of the millennial generation were born between 1981 and 1997. In 2017, they surpassed baby boomers as America’s largest generation. The marketing impact of millennials continues to be immense. These are technologically savvy and prosperous young people, with hundreds of billions of dollars to spend. And spend they do—freely, even though they haven’t yet reached their peak income and spending years.
In 2021, Statista.com reported that millennials were the largest group of online buyers, making them the key demographic for online sales. Other age groups, such as Generation X—people born between 1965 and 1980—and the baby boomers—born between 1946 and 1964—have their own spending patterns. Many boomers nearing retirement have money and are willing to spend it on their health, their comforts, leisure pursuits, and cars. As the population ages, businesses are offering more products that appeal to middle-aged and senior markets.
In addition, minorities represent more than 38 percent of the total population, with immigration bringing millions of new residents to the country over the past several decades. By 2060, the U.S. Census Bureau projects the minority population to increase to 56 percent of the total U.S. population. Companies recognize the value of hiring a diverse workforce that reflects our society. Minorities’ buying power has increased significantly as well, and companies are developing products and marketing campaigns that target different ethnic groups.
Social Factors
Social factors—our attitudes, values, ethics, and lifestyles—influence what, how, where, and when people purchase products or services. They are difficult to predict, define, and measure because they can be very subjective. They also change as people move through different life stages. People of all ages have a broader range of interests, defying traditional consumer profiles. They also experience a “poverty of time” and seek ways to gain more control over their time. Changing roles have brought more women into the workforce. This development is increasing family incomes, heightening demand for time-saving goods and services, changing family shopping patterns, and impacting individuals’ ability to achieve a work-life balance. In addition, a renewed emphasis on ethical behavior within organizations at all levels of the company has managers and employees alike searching for the right approach when it comes to gender inequality, sexual harassment, and other social behaviors that impact the potential for a business’s continued success.
Managing Change
Balancing Comes Easy at H&R Block
In an industry driven by deadlines and details, it’s hard to imagine striking a balance between work and everyday life for full-time employees and seasonal staff. Fortunately, the management team at H&R Block not only believes in maintaining a strong culture, it also tries to offer flexibility to its more than 70,000 employees and seasonal workers in 12,000 retail offices worldwide.
Based in Kansas City, Missouri, and built on a culture of providing exceptional customer service, H&R Block was recently named the top U.S. business with the best work-life balance by online job search site Indeed. Analyzing more than 10 million company reviews by employees, Indeed researchers identified the top 20 firms with the best work-life balance. H&R Block headed the 2017 list, followed by mortgage lender Network Capital Funding Corporation, fast food chain In-N-Out Burger, Texas food retailer H-E-B, and health services company Kaiser Permanente, among others.
According to Paul Wolfe, Indeed’s senior vice president of human resources, empathy on the part of organizations is a key factor in helping employees achieve balance. Wolfe says companies that demonstrate empathy and work diligently to provide personal time for all employees tend to take the top spots on the work-life balance list. “Comments we have seen from employee reviews for these companies indicate ‘fair’ and ‘flexible work environments,’” he says. Surprisingly, none of the tech companies known for their generous work perks made the top 20 list in 2017.
In this 24/7 world, when no one is far from a text or tweet, finding time for both family and work can be difficult, especially in the tax services industry, which is so schedule driven for a good part of the year. Making a commitment to help workers achieve a healthy work-life balance not only helps its employees, but it also helps H&R Block retain workers in a tight labor market where individuals continue to have choices when it comes to where and for whom they want to work.
Questions for Discussion
How does management’s support of employee work-life balance help the company’s bottom line?
What can other organizations learn from H&R Block when it comes to offering employee perks that encourage personal time for workers even during the busy tax season?
Sources: “Career Opportunities,” https://www.hrblock.com, accessed May 25, 2017; “About Us,” http://newsroom.hrblock.com, accessed May 25, 2017; Abigail Hess, “The 20 Best Companies for Work-Life Balance,” CNBC, http://www.cnbc.com, May 4, 2017; Kristen Bahler, “The 20 Best Companies for Work-Life Balance,” Money, http://time.com, April 20, 2017; Rachel Ritlop, “3 Benefits Companies Can Provide to Boost Work-Life Balance,” Forbes, http://www.forbes.com, January 30, 2017.
Technology
The application of technology can stimulate growth under capitalism or any other economic system. Technology is the application of science and engineering skills and knowledge to solve production and organizational problems. New equipment and software that improve productivity and reduce costs can be among a company’s most valuable assets. Productivity is the amount of goods and services one worker can produce. Our ability as a nation to maintain and build wealth depends in large part on the speed and effectiveness with which we use technology—to invent and adapt more efficient equipment to improve manufacturing productivity, to develop new products, and to process information and make it instantly available across the organization and to suppliers and customers.
Many U.S. businesses, large and small, use technology to create change, improve efficiencies, and streamline operations. For example, advances in cloud computing provide businesses with the ability to access and store data without running applications or programs housed on a physical computer or server in their offices. Such applications and programs can now be accessed through the internet. Mobile technology allows businesses to communicate with employees, customers, suppliers, and others at the swipe of a tablet or smartphone screen. Robots help businesses automate repetitive tasks that free up workers to focus on more knowledge-based tasks critical to business operations.
Concept Check
Define the components of the internal and the external business environments.
What factors within the economic environment affect businesses?
Why do demographic shifts and technological developments create both challenges and new opportunities for businesses?
1.3 How Business and Economics Work
Learning Outcomes
What are the primary features of the world’s economic systems, and how are the three sectors of the U.S. economy linked?
A business’s success depends in part on the economic systems of the countries where it is located and where it sells its products. A nation’s economic system is the combination of policies, laws, and choices made by its government to establish the systems that determine what goods and services are produced and how they are allocated. Economics is the study of how a society uses scarce resources to produce and distribute goods and services. The resources of a person, a firm, or a nation are limited. Hence, economics is the study of choices—what people, firms, or nations choose from among the available resources. Every economy is concerned with what types and amounts of goods and services should be produced, how they should be produced, and for whom. These decisions are made by the marketplace, the government, or both. In the United States, the government and the free-market system together guide the economy.
You probably know more about economics than you realize. Every day, many news stories deal with economic matters: a union wins wage increases at General Motors, the Federal Reserve Board lowers interest rates, Wall Street has a record day, the president proposes a cut in income taxes, consumer spending rises as the economy grows, or retail prices are on the rise, to mention just a few examples.
Global Economic Systems
Businesses and other organizations operate according to the economic systems of their home countries. Today the world’s major economic systems fall into two broad categories: free market, or capitalism; and planned economies, which include communism and socialism. However, in reality many countries use a mixed market system that incorporates elements from more than one economic system.
The major differentiator among economic systems is whether the government or individuals decide:
How to allocate limited resources—the factors of production—to individuals and organizations to best satisfy unlimited societal needs
What goods and services to produce and in what quantities
How and by whom these goods and services are produced
How to distribute goods and services to consumers
Managers must understand and adapt to the economic system or systems in which they operate. Companies that do business internationally may discover that they must make changes in production and selling methods to accommodate the economic system of other countries. Table 1.1 summarizes key factors of the world’s economic systems.
The Basic Economic Systems of the World
Capitalism
Communism
Socialism
Mixed Economy
Ownership of Business
Businesses are privately owned with minimal government ownership or interference.
Government owns all or most enterprises.
Basic industries such as railroads and utilities are owned by government. Very high taxation as government redistributes income from successful private businesses and entrepreneurs.
Private ownership of land and businesses but government control of some enterprises. The private sector is typically large
Control of Markets
Complete freedom of trade. No or little government control.
Complete government control of markets.
Some markets are controlled, and some are free. Significant central-government planning. State enterprises are managed by bureaucrats. These enterprises are rarely profitable.
Some markets, such as nuclear energy and the post office, are controlled or highly regulated.
Worker Incentives
Strong incentive to work and innovate because profits are retained by owners.
No incentive to work hard or produce quality products.
Private-sector incentives are the same as capitalism, and public-sector incentives are the same as in a planned economy.
Private-sector incentives are the same as capitalism. Limited incentives in the public sector.
Management of Enterprises
Each enterprise is managed by owners or professional managers with little government interference.
Centralized management by the government bureaucracy. Little or no flexibility in decision-making at the factory level.
Significant government planning and regulation. Bureaucrats run government enterprises.
Private-sector management similar to capitalism. Public sector similar to socialism.
Forecast for 2020
Continued steady growth.
No growth and perhaps disappearance.
Stable with probable slight growth.
Continued growth.
Examples
United States
Cuba, North Korea
Finland, India, Israel
Great Britain, France, Sweden, Canada
Table 1.1
Capitalism
In recent years, more countries have shifted toward free-market economic systems and away from planned economies. Sometimes, as was the case of the former East Germany, the transition to capitalism was painful but fairly quick. In other countries, such as Russia, the movement has been characterized by false starts and backsliding. Capitalism, also known as the private enterprise system, is based on competition in the marketplace and private ownership of the factors of production (resources). In a competitive economic system, a large number of people and businesses buy and sell products freely in the marketplace. In pure capitalism, all the factors of production are owned privately, and the government does not try to set prices or coordinate economic activity.
A capitalist system guarantees certain economic rights: the right to own property, the right to make a profit, the right to make free choices, and the right to compete. The right to own property is central to capitalism. The main incentive in this system is profit, which encourages entrepreneurship. Profit is also necessary for producing goods and services, building manufacturing plants, paying dividends and taxes, and creating jobs. The freedom to choose whether to become an entrepreneur or to work for someone else means that people have the right to decide what they want to do on the basis of their own drive, interest, and training. The government does not create job quotas for each industry or give people tests to determine what they will do.
Competition is good for both businesses and consumers in a capitalist system. It leads to better and more diverse products, keeps prices stable, and increases the efficiency of producers. Companies try to produce their goods and services at the lowest possible cost and sell them at the highest possible price. But when profits are high, more businesses enter the market to seek a share of those profits. The resulting competition among companies tends to lower prices. Companies must then find new ways of operating more efficiently if they are to keep making a profit—and stay in business.
Exhibit 1.5 McDonald’s China Since joining the World Trade Organization in 2001, China has continued to embrace tenets of capitalism and grow its economy. China is the world’s largest producer of mobile phones, PCs, and tablets, and the country’s over one billion people constitute a gargantuan market. The explosion of McDonald’s and KFC franchises epitomizes the success of American-style capitalism in China, and Beijing’s bid to host the 2022 Winter Olympics is a symbol of economic openness. This McCafé is an example of changing Western products to suit Chinese tastes. Do you think China’s capitalistic trend can continue to thrive under the ruling Chinese Communist Party that opposes workers’ rights, free speech, and democracy? (Credit: Marku Kudjerski/ flickr/ Attribution 2.0 Generic (CC BY 2.0))
Communism
The complete opposite of capitalism is communism. In a communist economic system, the government owns virtually all resources and controls all markets. Economic decision-making is centralized: the government, rather than the competitive forces in the marketplace, decides what will be produced, where it will be produced, how much will be produced, where the raw materials and supplies will come from, who will get the output, and what the prices will be. This form of centralized economic system offers little if any choice to a country’s citizens. Early in the 20th century, countries that chose communism, such as the former Soviet Union and China, believed that it would raise their standard of living. In practice, however, the tight controls over most aspects of people’s lives, such as what careers they can choose, where they can work, and what they can buy, led to lower productivity. Workers had no reason to work harder or produce quality goods, because there were no rewards for excellence. Errors in planning and resource allocation led to shortages of even basic items.
These factors were among the reasons for the 1991 collapse of the Soviet Union into multiple independent nations. Recent reforms in Russia, China, and most of the eastern European nations have moved these economies toward more capitalistic, market-oriented systems. North Korea and Cuba are the best remaining examples of communist economic systems. Time will tell whether Cuba takes small steps toward a market economy now that the United States reestablished diplomatic relations with the island country a few years ago.
For more information on communism, view the linked KHAN ACADEMY® video lecture, “Communism.”
Attribution-NonCommercial-ShareAlike 3.0 United States (CC BY-NC-SA 3.0 US). Note: All Khan Academy content is available for free.
Socialism
Socialism is an economic system in which the basic industries are owned by the government or by the private sector under strong government control. A socialist state controls critical, large-scale industries such as transportation, communications, and utilities. Smaller businesses and those considered less critical, such as retail, may be privately owned. To varying degrees, the state also determines the goals of businesses, the prices and selection of goods, and the rights of workers. Socialist countries typically provide their citizens with a higher level of services, such as health care and unemployment benefits, than do most capitalist countries. As a result, taxes and unemployment may also be higher in socialist countries. For example, in 2017, the top individual tax rate in France was 45 percent, compared to 39.6 percent in the United States. With both countries electing new presidents in 2017, tax cuts were a campaign promise that both President Macron and President Trump took on as part of their overall economic agendas.
Many countries, including the United Kingdom, Denmark, India, and Israel, have socialist systems, but the systems vary from country to country. In Denmark, for example, most businesses are privately owned and operated, but two-thirds of the population is sustained by the state through government welfare programs.
Mixed Economic Systems
Pure capitalism and communism are extremes; real-world economies fall somewhere between the two. The U.S. economy leans toward pure capitalism, but it uses government policies to promote economic stability and growth. Also, through policies and laws, the government transfers money to the poor, the unemployed, and the elderly or disabled. American capitalism has produced some very powerful organizations in the form of large corporations, such as General Motors and Microsoft. To protect smaller firms and entrepreneurs, the government has passed legislation that requires that the giants compete fairly against weaker competitors.
Canada, Sweden, and the UK, among others, are also called mixed economies; that is, they use more than one economic system. Sometimes, the government is basically socialist and owns basic industries. In Canada, for example, the government owns the communications, transportation, and utilities industries, as well as some of the natural-resource industries. It also provides health care to its citizens. But most other activity is carried on by private enterprise, as in a capitalist system. In 2016, UK citizens voted for Britain to leave the European Union, a move that will take two or more years to finalize. It is too early to tell what impact the Brexit decision will have on the UK economy and other economies around the world.18
The few factors of production owned by the government in a mixed economy include some public lands, the postal service, and some water resources. But the government is extensively involved in the economic system through taxing, spending, and welfare activities. The economy is also mixed in the sense that the country tries to achieve many social goals—income redistribution and retirement pensions, for example—that may not be attempted in purely capitalist systems.
The state of the economy affects both people and businesses. How you spend your money (or save it) is a personal economic decision. Whether you continue in school and whether you work part-time are also economic decisions. Every business also operates within the economy. Based on their economic expectations, businesses decide what products to produce, how to price them, how many people to employ, how much to pay these employees, how much to expand the business, and so on.
Economics has two main subareas. Macroeconomics is the study of the economy as a whole. It looks at aggregate data for large groups of people, companies, or products considered as a whole. In contrast, microeconomics focuses on individual parts of the economy, such as households or firms.
Both macroeconomics and microeconomics offer a valuable outlook on the economy. For example, Ford might use both to decide whether to introduce a new line of vehicles. The company would consider such macroeconomic factors as the national level of personal income, the unemployment rate, interest rates, fuel costs, and the national level of sales of new vehicles. From a microeconomic viewpoint, Ford would judge consumer demand for new vehicles versus the existing supply, competing models, labor and material costs and availability, and current prices and sales incentives.
Economics as a Circular Flow
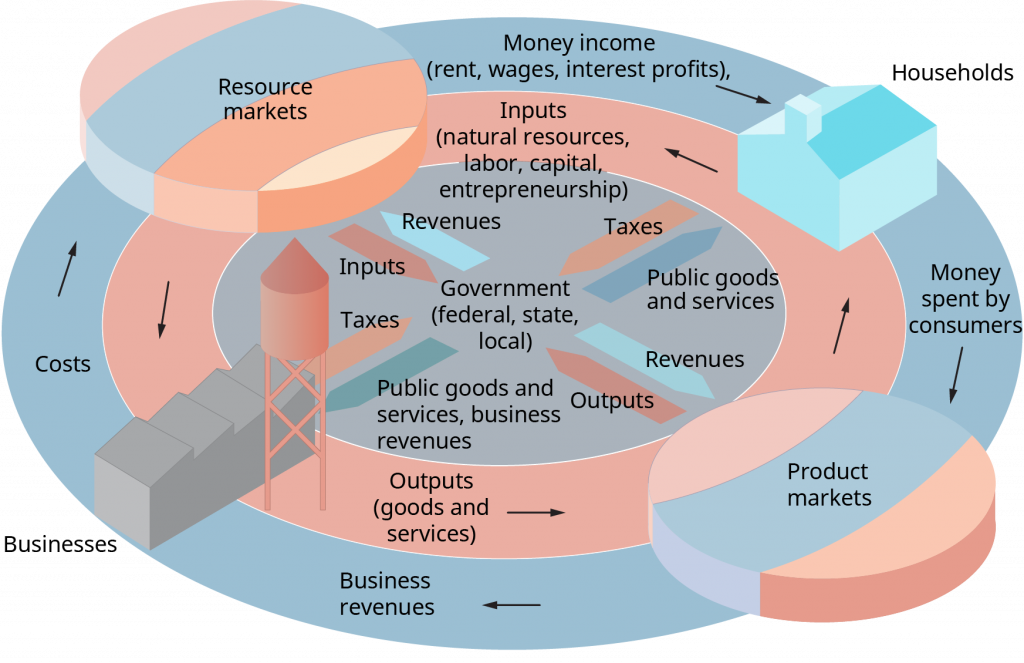
Another way to see how the sectors of the economy interact is to examine the circular flow of inputs and outputs among households, businesses, and governments as shown in Exhibit 1.6. Let’s review the exchanges by following the red circle around the inside of the diagram. Households provide inputs (natural resources, labor, capital, entrepreneurship, knowledge) to businesses, which convert these inputs into outputs (goods and services) for consumers. In return, households receive income from rent, wages, interest, and ownership profits (blue circle). Businesses receive revenue from consumer purchases of goods and services.
The other important exchange in Exhibit 1.6 takes place between governments (federal, state, and local) and both households and businesses. Governments supply many types of publicly provided goods and services (highways, schools, police, courts, health services, unemployment insurance, social security) that benefit consumers and businesses. Government purchases from businesses also contribute to business revenues. When a construction firm repairs a local stretch of state highway, for example, government pays for the work. As the diagram shows, government receives taxes from households and businesses to complete the flow.
Changes in one flow affect the others. If government raises taxes, households have less to spend on goods and services. Lower consumer spending causes businesses to reduce production, and economic activity declines; unemployment may rise. In contrast, cutting taxes can stimulate economic activity. Keep the circular flow in mind as we continue our study of economics. The way economic sectors interact will become more evident as we explore macroeconomics and microeconomics.
Exhibit 1.6 Economics as a Circular Flow (Attribution: Copyright Rice University, OpenStax, under CC-BY 4.0 license)
Concept Check
What is economics, and how can you benefit from understanding basic economic concepts?
Compare and contrast the world’s major economic systems. Why is capitalism growing, communism declining, and socialism still popular?
What is the difference between macroeconomics and microeconomics?
1.4 Macroeconomics: The Big Picture
Learning Outcomes
How do economic growth, full employment, price stability, and inflation indicate a nation’s economic health?
Have you ever looked at CNN’s Headline News on a mobile device or turned on the radio and heard something like, “Today the Labor Department reported that for the second straight month unemployment declined”? Statements like this are macroeconomic news. Understanding the national economy and how changes in government policies affect households and businesses is a good place to begin our study of economics.
Let’s look first at macroeconomic goals and how they can be met. The United States and most other countries have three main macroeconomic goals: economic growth, full employment, and price stability. A nation’s economic well-being depends on carefully defining these goals and choosing the best economic policies for achieving them.
Striving for Economic Growth
Perhaps the most important way to judge a nation’s economic health is to look at its production of goods and services. The more the nation produces, the higher its standard of living. An increase in a nation’s output of goods and services is economic growth.
The most basic measure of economic growth is the gross domestic product (GDP). GDP is the total market value of all final goods and services produced within a nation’s borders each year. The Bureau of Labor Statistics publishes quarterly GDP figures that can be used to compare trends in national output. When GDP rises, the economy is growing.
The rate of growth in real GDP (GDP adjusted for inflation) is also important. Recently, the U.S. economy has been growing at a slow but steady rate of between 3 and 4 percent annually. This growth rate has meant a steady increase in the output of goods and services and relatively low unemployment. When the growth rate slides toward zero, the economy begins to stagnate and decline.
One country that continues to grow more rapidly than most is China, whose GDP has been growing at 6 to 7 percent per year. Today, few things in the global marketplace are not or cannot be made in China. The primary contributor to China’s rapid growth has been technology. For example, most tablets and laptops are manufactured in China.
The level of economic activity is constantly changing. These upward and downward changes are called business cycles. Business cycles vary in length, in how high or low the economy moves, and in how much the economy is affected. Changes in GDP trace the patterns as economic activity expands and contracts. An increase in business activity results in rising output, income, employment, and prices. Eventually, these all peak, and output, income, and employment decline. A decline in GDP that lasts for two consecutive quarters (each a three-month period) is called a recession. It is followed by a recovery period when economic activity once again increases. The most recent recession began in December 2007 and ended in June 2009.
Businesses must monitor and react to the changing phases of business cycles. When the economy is growing, companies often have a difficult time hiring good employees and finding scarce supplies and raw materials. When a recession hits, many firms find they have more capacity than the demand for their goods and services requires. During the most recent recession, many businesses operated at substantially lower than capacity. When plants use only part of their capacity, they operate inefficiently and have higher costs per unit produced. Let’s say that Mars Corp. has a huge plant that can produce one million Milky Way candy bars a day, but because of a recession Mars can sell only half a million candy bars a day. The plant uses large, expensive machines. Producing Milky Ways at 50 percent capacity does not efficiently utilize Mars’s investment in its plant and equipment.
Keeping People on the Job
Another macroeconomic goal is full employment, or having jobs for all who want to and can work. Full employment doesn’t actually mean 100 percent employment. Some people choose not to work for personal reasons (attending school, raising children) or are temporarily unemployed while they wait to start a new job. Thus, the government defines full employment as the situation when about 94 to 96 percent of those available to work actually have jobs. During the 2007–2009 recession in the United States, the unemployment rate peaked at 10 percent in October 2009. Today, that rate hovers at about 4 percent.
Maintaining low unemployment levels is of concern not just to the United States but also to countries around the world. For example, high youth unemployment rates (for workers 25 years of age and younger) in Spain, Italy, and Greece continue to cause protests in these European countries as elected officials struggle with how to turn around their respective economies and put more people, particularly young people, back to work. The UK’s impending exit from the European Union may also have an effect on unemployment rates, as global companies move jobs out of Britain to central European countries such as Poland.
Measuring Unemployment
To determine how close we are to full employment, the government measures the unemployment rate. This rate indicates the percentage of the total labor force that is not working but is actively looking for work. It excludes “discouraged workers,” those not seeking jobs because they think no one will hire them. Each month the U.S. Department of Labor releases statistics on employment. These figures help us understand how well the economy is doing.
For more information on calculating unemployment, view the linked KHAN ACADEMY® video lecture, “Unemployment rate primer.”
Attribution-NonCommercial-ShareAlike 3.0 United States (CC BY-NC-SA 3.0 US). Note: All Khan Academy content is available for free.
Types of Unemployment
Economists classify unemployment into four types: frictional, structural, cyclical, and seasonal. The categories are of small consolation to someone who is unemployed, but they help economists understand the problem of unemployment in our economy.
Frictional unemployment is short-term unemployment that is not related to the business cycle. It includes people who are unemployed while waiting to start a better job, those who are reentering the job market, and those entering for the first time, such as new college graduates. This type of unemployment is always present and has little impact on the economy.
Structural unemployment is also unrelated to the business cycle but is involuntary. It is caused by a mismatch between available jobs and the skills of available workers in an industry or a region. For example, if the birthrate declines, fewer teachers will be needed. Or the available workers in an area may lack the skills that employers want. Retraining and skill-building programs are often required to reduce structural unemployment.
Cyclical unemployment, as the name implies, occurs when a downturn in the business cycle reduces the demand for labor throughout the economy. In a long recession, cyclical unemployment is widespread, and even people with good job skills can’t find jobs. The government can partly counteract cyclical unemployment with programs that boost the economy.
In the past, cyclical unemployment affected mainly less-skilled workers and those in heavy manufacturing. Typically, they would be rehired when economic growth increased. Since the 1990s, however, competition has forced many American companies to downsize so they can survive in the global marketplace. These job reductions affected workers in all categories, including middle management and other salaried positions. Firms continue to reevaluate workforce requirements and downsize to stay competitive to compete with Asian, European, and other U.S. firms. After a strong rebound from the global recession of 2007–2009, when the auto industry slashed more than 200,000 hourly and salaried workers from their payrolls, the automakers are now taking another close look at the size of their global workforces. For example, as sales steadily rose after the recession, Ford Motor Company’s workforce in North America increased by 25 percent over the past five years. As car sales plateaued in 2017, the company recently announced it would cut approximately 10 percent of its global workforce in an effort to reduce costs, boost profits, and increase its stock value for shareholders.21
The last type is seasonal unemployment, which occurs during specific times of the year in certain industries. Employees subject to seasonal unemployment include retail workers hired for the holiday shopping season, lettuce pickers in California, and restaurant employees in ski country during the summer.
Keeping Prices Steady
The third macroeconomic goal is to keep overall prices for goods and services fairly steady. The situation in which the average of all prices of goods and services is rising is called inflation. Inflation’s higher prices reduce purchasing power, the value of what money can buy. Purchasing power is a function of two things: inflation and income. If incomes rise at the same rate as inflation, there is no change in purchasing power. If prices go up but income doesn’t rise or rises at a slower rate, a given amount of income buys less, and purchasing power falls. For example, if the price of a basket of groceries rises from $30 to $40 but your salary remains the same, you can buy only 75 percent as many groceries ($30 ÷ $40) for $30. Your purchasing power declines by 25 percent ($10 ÷ $40). If incomes rise at a rate faster than inflation, then purchasing power increases. So you can, in fact, have rising purchasing power even if inflation is increasing. Typically, however, inflation rises faster than incomes, leading to a decrease in purchasing power.
Inflation affects both personal and business decisions. When prices are rising, people tend to spend more—before their purchasing power declines further. Businesses that expect inflation often increase their supplies, and people often speed up planned purchases of cars and major appliances.
From the early 2000s to April 2017, inflation in the United States was very low, in the 0.1 to 3.8 percent range; for 2016 it was 1.3 percent. For comparison, in the 1980s, the United States had periods of inflation in the 12 to 13 percent range.22 Some nations have had high double- and even triple-digit inflation in recent years. As of early 2017, the monthly inflation rate in Venezuela was an astounding 741 percent, followed by the African country of South Sudan at 273 percent.23
Exhibit 1.7 Nespresso Buyers of Nespresso coffee, KitKat chocolate bars, and Purina pet food are paying more for these items as global food giant Nestlé raises prices. Increasing input costs, such as costs of raw materials, have been hard on food businesses, raising the price of production, packaging, and transportation. How might fluctuations in the producer price index (PPI) affect the consumer price index (CPI) and why? (Credit: Kārlis Dambrāns/ flickr/ Attribution 2.0 Generic (CC BY 2.0))
Types of Inflation
There are two types of inflation. Demand-pull inflation occurs when the demand for goods and services is greater than the supply. Would-be buyers have more money to spend than the amount needed to buy available goods and services. Their demand, which exceeds the supply, tends to pull prices up. This situation is sometimes described as “too much money chasing too few goods.” The higher prices lead to greater supply, eventually creating a balance between demand and supply.
Cost-push inflation is triggered by increases in production costs, such as expenses for materials and wages. These increases push up the prices of final goods and services. Wage increases are a major cause of cost-push inflation, creating a “wage-price spiral.” For example, assume the United Auto Workers union negotiates a three-year labor agreement that raises wages 3 percent per year and increases overtime pay. Carmakers will then raise car prices to cover their higher labor costs. Also, the higher wages will give autoworkers more money to buy goods and services, and this increased demand may pull up other prices. Workers in other industries will demand higher wages to keep up with the increased prices, and the cycle will push prices even higher.
How Inflation Is Measured
The rate of inflation is most commonly measured by looking at changes in the consumer price index (CPI), an index of the prices of a “market basket” of goods and services purchased by typical urban consumers. It is published monthly by the Department of Labor. Major components of the CPI, which are weighted by importance, are food and beverages, clothing, transportation, housing, medical care, recreation, and education. There are special indexes for food and energy. The Department of Labor collects about 80,000 retail price quotes and 5,000 housing rent figures to calculate the CPI.
The CPI sets prices in a base period at 100. The base period, which now is 1982–1984, is chosen for its price stability. Current prices are then expressed as a percentage of prices in the base period. A rise in the CPI means prices are increasing. For example, the CPI was 244.5 in April 2017, meaning that prices more than doubled since the 1982–1984 base period.
Changes in wholesale prices are another important indicator of inflation. The producer price index (PPI) measures the prices paid by producers and wholesalers for various commodities, such as raw materials, partially finished goods, and finished products. The PPI, which uses 1982 as its base year, is actually a family of indexes for many different product categories, including crude goods (raw materials), intermediate goods (which become part of finished goods), and finished goods. For example, the PPI for finished goods was 197.7 in April 2017, a 3.9-point increase, and for chemicals was 106.5, up 3.8 points since April 2016. Examples of other PPI indexes include processed foods, lumber, containers, fuels and lubricants, metals, and construction. Because the PPI measures prices paid by producers for raw materials, energy, and other commodities, it may foreshadow subsequent price changes for businesses and consumers.
The Impact of Inflation
Inflation has several negative effects on people and businesses. For one thing, inflation penalizes people who live on fixed incomes. Let’s say that a couple receives $2,000 a month in retirement income beginning in 2018. If inflation is 10 percent in 2019, then the couple can buy only about 91 percent (100 ÷ 110) of what they could purchase in 2018. Similarly, inflation hurts savers. As prices rise, the real value, or purchasing power, of a nest egg of savings deteriorates.
Concept Check
What is a business cycle? How do businesses adapt to periods of contraction and expansion?
Why is full employment usually defined as a target percentage below 100 percent?
What is the difference between demand-pull and cost-push inflation?
1.5 Achieving Macroeconomic Goals
Learning Outcomes
How does the government use monetary policy and fiscal policy to achieve its macroeconomic goals?
To reach macroeconomic goals, countries must often choose among conflicting alternatives. Sometimes political needs override economic needs. For example, bringing inflation under control may call for a politically difficult period of high unemployment and low growth. Or, in an election year, politicians may resist raising taxes to curb inflation. Still, the government must try to guide the economy to a sound balance of growth, employment, and price stability. The two main tools it uses are monetary policy and fiscal policy.
Monetary Policy
Monetary policy refers to a government’s programs for controlling the amount of money circulating in the economy and interest rates. Changes in the money supply affect both the level of economic activity and the rate of inflation. The Federal Reserve System (the Fed), the central banking system of the United States, prints money and controls how much of it will be in circulation. The money supply is also controlled by the Fed’s regulation of certain bank activities.
When the Fed increases or decreases the amount of money in circulation, it affects interest rates (the cost of borrowing money and the reward for lending it). The Fed can change the interest rate on money it lends to banks to signal the banking system and financial markets that it has changed its monetary policy. These changes have a ripple effect. Banks, in turn, may pass along this change to consumers and businesses that receive loans from the banks. If the cost of borrowing increases, the economy slows because interest rates affect consumer and business decisions to spend or invest. The housing industry, business, and investments react most to changes in interest rates.
As a result of the 2007–2009 recession and the global financial crisis that ensued, the Fed dropped the federal funds rate—the interest rate charged on overnight loans between banks—to 0 percent in December 2008 and kept the rate at zero until December 2015, when it raised the rate to 0.25 percent. This decision marked the first increase in the federal-funds rate since June 2006, when the federal funds rate was 5.25 percent. As the U.S. economy continues to show a slow but steady expansion, the Fed subsequently increased the federal funds rate to a range of 0.75 to 1 percent in March 2017. As expected, this change has a ripple effect: the regional Federal Reserve Banks increase the discount rate they charge commercial banks for short-term loans, many commercial banks raise the interest rates they charge their customers, and credit card companies increase the annual percentage rate (APR) they charge consumers on their credit card balances.24
As you can see, the Fed can use monetary policy to contract or expand the economy. With contractionary policy, the Fed restricts, or tightens, the money supply by selling government securities or raising interest rates. The result is slower economic growth and higher unemployment. Thus, contractionary policy reduces spending and, ultimately, lowers inflation. With expansionary policy, the Fed increases, or loosens, growth in the money supply. An expansionary policy stimulates the economy. Interest rates decline, so business and consumer spending go up. Unemployment rates drop as businesses expand. But increasing the money supply also has a negative side: more spending pushes prices up, increasing the inflation rate.
Exhibit 1.8 As chair of the Board of Governors of the Federal Reserve System, Jerome (Jay) Powell is considered the face of U.S. monetary policy. Powell took over the chair in February 2018 from Janet Yellen, the first woman ever to be appointed Fed chair. What are the responsibilities of the chair of the Board of Governors of the Federal Reserve System? (Credit: Federalreserve/ flickr/ US Government Works)
Fiscal Policy
The other economic tool used by the government is fiscal policy, its program of taxation and spending. By cutting taxes or by increasing spending, the government can stimulate the economy. Look again at Exhibit 1.6. The more government buys from businesses, the greater the business revenues and output. Likewise, if consumers or businesses have to pay less in taxes, they will have more income to spend for goods and services. Tax policies in the United States therefore affect business decisions. High corporate taxes can make it harder for U.S. firms to compete with companies in countries with lower taxes. As a result, companies may choose to locate facilities overseas to reduce their tax burden.
Nobody likes to pay taxes, although we grudgingly accept that we have to. Although most U.S. citizens complain that they are overtaxed, we pay lower taxes per capita (per person) than citizens in many countries similar to ours. In addition, our taxes represent a lower percentage of gross income and GDP compared to most countries.
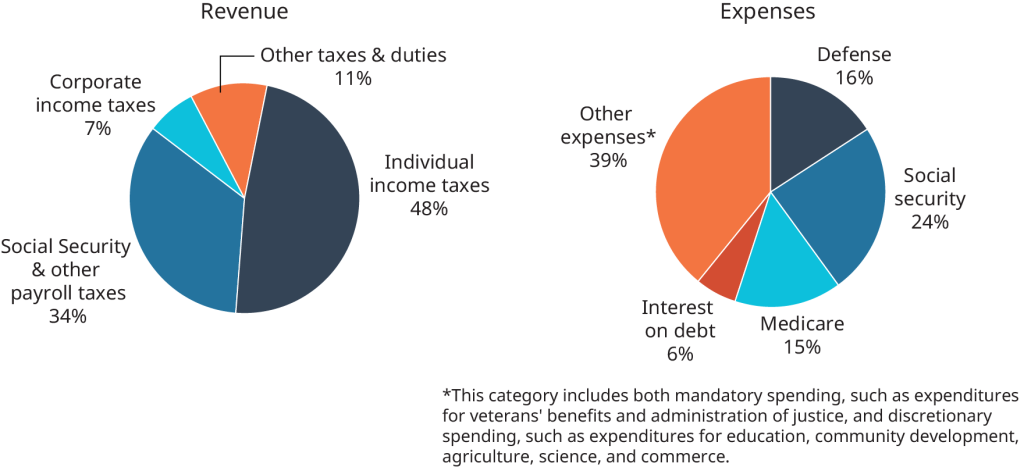
Taxes are, of course, the major source of revenue for our government. Every year, the president prepares a budget for the coming year based upon estimated revenues and expenditures. Congress receives the president’s report and recommendations and then, typically, debates and analyzes the proposed budget for several months. The president’s original proposal is always modified in numerous ways. Exhibit 1.9 shows the sources of revenue and expenses for the U.S. budget.
Exhibit 1.9 Revenues and Expenses for the Federal Budget Source: U.S. Treasury, “Final Monthly Treasury Statement of Receipts and Outlays of the United States Government for Fiscal Year 2016,” https://www.fiscal.treasury.gov, accessed May 23, 2017.
Whereas fiscal policy has a major impact on business and consumers, continual increases in government spending raise another important issue. When government takes more money from business and consumers (the private sector), a phenomenon known as crowding out occurs. Here are three examples of crowding out:
The government spends more on public libraries, and individuals buy fewer books at bookstores.
The government spends more on public education, and individuals spend less on private education.
The government spends more on public transportation, and individuals spend less on private transportation.
In other words, government spending is crowding out private spending.
If the government spends more for programs (social services, education, defense) than it collects in taxes, the result is a federal budget deficit. To balance the budget, the government can cut its spending, increase taxes, or do some combination of the two. When it cannot balance the budget, the government must make up any shortfalls by borrowing (just like any business or household).
In 1998, for the first time in a generation, there was a federal budget surplus (revenue exceeding spending) of about $71 billion. That budget surplus was short lived, however. By 2005, the deficit was more than $318 billion. In the fiscal year of 2009, the federal deficit was at an all-time high of more than $1.413 trillion. Six years later, at the end of the 2015 fiscal year, the deficit decreased to $438 billion.25 The U.S. government has run budget deficits for many years. The accumulated total of these past deficits is the national debt, which now amounts to about $19.8 trillion, or about $61,072 for every man, woman, and child in the United States. Total interest on the debt is more than $2.5 trillion a year.26 To cover the deficit, the U.S. government borrows money from people and businesses in the form of Treasury bills, Treasury notes, and Treasury bonds. These are federal IOUs that pay interest to their owners.
The national debt is an emotional issue debated not only in the halls of Congress, but by the public as well. Some believe that deficits contribute to economic growth, high employment, and price stability. Others have the following reservations about such a high national debt:
Not Everyone Holds the Debt: The government is very conscious of who actually bears the burden of the national debt and keeps track of who holds what bonds. If only the rich were bondholders, then they alone would receive the interest payments and could end up receiving more in interest than they paid in taxes. In the meantime, poorer people, who held no bonds, would end up paying taxes that would be transferred to the rich as interest, making the debt an unfair burden to them. At times, therefore, the government has instructed commercial banks to reduce their total debt by divesting some of their bond holdings. That’s also why the Treasury created savings bonds. Because these bonds are issued in relatively small denominations, they allow more people to buy and hold government debt.
It Crowds Out Private Investment: The national debt also affects private investment. If the government raises the interest rate on bonds to be able to sell them, it forces private businesses, whose corporate bonds (long-term debt obligations issued by a company) compete with government bonds for investor dollars, to raise rates on their bonds to stay competitive. In other words, selling government debt to finance government spending makes it more costly for private industry to finance its own investment. As a result, government debt may end up crowding out private investment and slowing economic growth in the private sector.
Concept Check
What are the two kinds of monetary policy?
What fiscal policy tools can the government use to achieve its macroeconomic goals?
What problems can a large national debt present?
Microeconomics: Zeroing in on Businesses and Consumers
Learning Outcomes
What are the basic microeconomic concepts of demand and supply, and how do they establish prices?
Now let’s shift our focus from the whole economy to microeconomics, the study of households, businesses, and industries. This field of economics is concerned with how prices and quantities of goods and services behave in a free market. It stands to reason that people, firms, and governments try to get the most from their limited resources. Consumers want to buy the best quality at the lowest price. Businesses want to keep costs down and revenues high to earn larger profits. Governments also want to use their revenues to provide the most effective public goods and services possible. These groups choose among alternatives by focusing on the prices of goods and services.
As consumers in a free market, we influence what is produced. If Mexican food is popular, the high demand attracts entrepreneurs who open more Mexican restaurants. They want to compete for our dollars by supplying Mexican food at a lower price, of better quality, or with different features, such as Santa Fe Mexican food rather than Tex-Mex. This section explains how business and consumer choices influence the price and availability of goods and services.
Exhibit 1.10 Galaxy Note 7 Samsung’s strategy to take on Apple’s iPhone domination hit a terrible snag in 2016, when its Galaxy Note 7 mobile phone was recalled and the product eliminated. Defective batteries in the Note 7 made them catch fire and cause serious damage. Samsung eventually killed the entire line of Note 7 phones, recalling nearly 3 million phones, which cost the company more than $5 billion. How do businesses determine the optimum quantity of products or services to make available to consumers? (Credit: Paul Sullivan/ flickr/ Attribution-NoDerivs 2.0 Generic (CC BY-ND 2.0))
The Nature of Demand
Demand is the quantity of a good or service that people are willing to buy at various prices. The higher the price, the lower the quantity demanded, and vice versa. A graph of this relationship is called a demand curve.
Let’s assume you own a store that sells jackets for snowboarders. From past experience, you know how many jackets you can sell at different prices. The demand curve in Exhibit 1.11 depicts this information. The x-axis (horizontal axis) shows the quantity of jackets, and the y-axis (vertical axis) shows the related price of those jackets. For example, at a price of $100, customers will buy (demand) 600 snowboard jackets.
In the graph, the demand curve slopes downward and to the right because as the price falls, people will want to buy more jackets. Some people who were not going to buy a jacket will purchase one at the lower price. Also, some snowboarders who already have a jacket will buy a second one. The graph also shows that if you put a large number of jackets on the market, you will have to reduce the price to sell all of them.
Understanding demand is critical to businesses. Demand tells you how much you can sell and at what price—in other words, how much money the firm will take in that can be used to cover costs and hopefully earn a profit. Gauging demand is difficult even for the very largest corporations, but particularly for small firms.
Exhibit 1.11 Demand Curve for Jackets for Snowboarders (Attribution: Copyright Rice University, OpenStax, under CC-BY 4.0 license)
The Nature of Supply
Demand alone is not enough to explain how the market sets prices. We must also look at supply, the quantity of a good or service that businesses will make available at various prices. The higher the price, the greater the number of jackets a supplier will supply, and vice versa. A graph of the relationship between various prices and the quantities a business will supply is a supply curve.
We can again plot the quantity of jackets on the x-axis and the price on the y-axis. As Exhibit 1.12 shows, 800 jackets will be available at a price of $100. Note that the supply curve slopes upward and to the right, the opposite of the demand curve. If snowboarders are willing to pay higher prices, suppliers of jackets will buy more inputs (for example, Gore-Tex® fabric, dye, machinery, labor) and produce more jackets. The quantity supplied will be higher at higher prices, because manufacturers can earn higher profits.
Exhibit 1.12 Supply Curve for Jackets for Snowboarders (Attribution: Copyright Rice University, OpenStax, under CC-BY 4.0 license)
How Demand and Supply Interact to Determine Prices
In a stable economy, the number of jackets that snowboarders demand depends on the jackets’ price. Likewise, the number of jackets that suppliers provide depends on price. But at what price will consumer demand for jackets match the quantity suppliers will produce?
To answer this question, we need to look at what happens when demand and supply interact. By plotting both the demand curve and the supply curve on the same graph in Exhibit 1.13, we see that they cross at a certain quantity and price. At that point, labeled E, the quantity demanded equals the quantity supplied. This is the point of equilibrium. The equilibrium price is $80; the equilibrium quantity is 700 jackets. At that point, there is a balance between the quantity consumers will buy and the quantity suppliers will make available.
Market equilibrium is achieved through a series of quantity and price adjustments that occur automatically. If the price increases to $160, suppliers produce more jackets than consumers are willing to buy, and a surplus results. To sell more jackets, prices will have to fall. Thus, a surplus pushes prices downward until equilibrium is reached. When the price falls to $60, the quantity of jackets demanded rises above the available supply. The resulting shortage forces prices upward until equilibrium is reached at $80.
Exhibit 1.13 Equilibrium Price and Quantity for Jackets for Snowboarders (Attribution: Copyright Rice University, OpenStax, under CC-BY 4.0 license)
The number of snowboard jackets supplied and bought at $80 will tend to rest at equilibrium unless there is a shift in either demand or supply. If demand increases, more jackets will be purchased at every price, and the demand curve shifts to the right (as illustrated by line D2 in Exhibit 1.14). If demand decreases, fewer jackets will be bought at every price, and the demand curve shifts to the left (D1). When demand decreased, snowboarders bought 500 jackets at $80 instead of 700 jackets. When demand increased, they purchased 800.
Changes in Demand
A number of things can increase or decrease demand. For example, if snowboarders’ incomes go up, they may decide to buy a second jacket. If incomes fall, a snowboarder who was planning to purchase a jacket may wear an old one instead. Changes in fashion or tastes can also influence demand. If snowboarding were suddenly to go out of fashion, demand for jackets would decrease quickly. A change in the price of related products can also influence demand. For example, if the average price of a snowboard rises to $1,000, people will quit snowboarding, and jacket demand will fall.
Another factor that can shift demand is expectations about future prices. If you expect jacket prices to increase significantly in the future, you may decide to go ahead and get one today. If you think prices will fall, you will postpone your purchase. Finally, changes in the number of buyers will affect demand. Snowboarding is a young person’s sport, and the number of teenagers will increase in the next few years. Therefore, the demand for snowboard jackets should increase.
Exhibit 1.14 Shifts in Demand for Jackets for Snowboarders (Attribution: Copyright Rice University, OpenStax, under CC-BY 4.0 license)
Changes in Supply
Other factors influence the supply side of the picture. New technology typically lowers the cost of production. For example, North Face, a supplier of ski and snowboard jackets, purchased laser-guided pattern-cutting equipment and computer-aided pattern-making equipment. Each jacket was cheaper to produce, resulting in a higher profit per jacket. This provided an incentive to supply more jackets at every price. If the price of resources such as labor or fabric goes up, North Face will earn a smaller profit on each jacket, and the amount supplied will decrease at every price. The reverse is also true. Changes in the prices of other goods can also affect supply.
Let’s say that snow skiing becomes a really hot sport again. The number of skiers jumps dramatically, and the price of ski jackets soars. North Face can use its machines and fabrics to produce either ski or snowboard jackets. If the company can make more profit from ski jackets, it will produce fewer snowboard jackets at every price. Also, a change in the number of producers will shift the supply curve. If the number of jacket suppliers increases, they will place more jackets on the market at every price. If any suppliers stop making jackets available, the supply will naturally decrease. Taxes can also affect supply. If the government decides, for some reason, to tax the supplier for every snowboard jacket produced, then profits will fall, and fewer jackets will be offered at every price. Table 1.2 summarizes the factors that can shift demand and supply curves.
To better understand the relationship between supply and demand across the economy, consider the impact of 2005’s Hurricane Katrina on U.S. energy prices. Oil and gas prices were already at high levels before Hurricane Katrina disrupted production in the Gulf Coast. Most U.S. offshore drilling sites are located in the Gulf of Mexico, and almost 30 percent of U.S. refining capacity is in Gulf States that were hit hard by the storm. Prices rose almost immediately as supplies fell while demand remained at the same levels.
The storm drove home the vulnerability of the U.S. energy supply to not only natural disasters, but also terrorist attacks and price increases from foreign oil producers. Many energy policy experts questioned the wisdom of having such a high concentration of oil facilities—about 25 percent of the oil and natural gas infrastructure—in hurricane-prone states. Refiners were already almost at capacity before Katrina’s devastation.27
Factors That Cause Demand and Supply Curves to Shift
Shift Demand
Factor
To the Right If
To the Left If
Buyers’ incomes
Increase
Decrease
Buyers’ preferences/tastes
Increase
Decrease
Prices of substitute products
Increase
Decrease
Expectations about future prices
Will rise
Will fall
Number of buyers
Increases
Decreases
Shift Supply
To the Right If
To the Left If
Technology
Lowers cost
Increases cost
Resource prices
Fall
Rise
Changes in prices of other products that can be produced with the same resources
Profit of other product falls
Profit of other product rises
Number of suppliers
Increases
Decreases
Taxes
Decreases
Increases
Table 1.2
High energy prices affect the economy in many ways. With oil at the time costing $50 to $60 a barrel—more than double the 2003 price—both businesses and consumers across the United States felt the pinch in their wallets. Midwestern agricultural businesses export about 70 percent of their grain production through Gulf of Mexico port facilities. With fewer usable docking spaces, barges couldn’t unload and return for more crops. The supply of both transportation services and grain products was inadequate to meet demand, pushing up transportation and grain costs. Higher gas prices also contributed to rising prices, as 80 percent of shipping costs are related to fuel.
More than a decade after Katrina, U.S. gas prices have fluctuated dramatically, with the cost of a gallon of regular gas peaking in 2014 at $3.71, dropping as low as $1.69 in early 2015, and moderating to $2.36 in mid-2017. Recent research by JP Morgan Chase revealed that consumers spend roughly 80 percent of their savings from lower gas prices, which helps the overall economy.28
Concept Check
What is the relationship between prices and demand for a product?
How is market equilibrium achieved? Describe the circumstances under which the price of gasoline would have returned to equilibrium in the United States after Hurricane Katrina.
Draw a graph that shows an equilibrium point for supply and demand.
Competing in a Free Market
Learning Outcomes
What are the four types of market structure?
One of the characteristics of a free-market system is that suppliers have the right to compete with one another. The number of suppliers in a market defines the market structure. Economists identify four types of market structures: (1) perfect competition, (2) pure monopoly, (3) monopolistic competition, and (4) oligopoly. Table 1.3 summarizes the characteristics of each of these market structures.
Perfect Competition
Characteristics of perfect (pure) competition include:
A large number of small firms are in the market.
The firms sell similar products; that is, each firm’s product is very much like the products sold by other firms in the market.
Buyers and sellers in the market have good information about prices, sources of supply, and so on.
It is easy to open a new business or close an existing one.
Comparison of Market Structures
Characteristics
Perfect Competition
Pure Monopoly
Monopolistic Competition
Oligopoly
Number of firms in market
Many
One
Many, but fewer than perfect competition
Few
Firm’s ability to control price
None
High
Some
Some
Barriers to entry
None
Subject to government regulation
Few
Many
Product differentiation
Very little
No products that compete directly
Emphasis on showing perceived differences in products
In a perfectly competitive market, firms sell their products at prices determined solely by forces beyond their control. Because the products are very similar and each firm contributes only a small amount to the total quantity supplied by the industry, price is determined by supply and demand. A firm that raised its price even a little above the going rate would lose customers. In the wheat market, for example, the product is essentially the same from one wheat producer to the next. Thus, none of the producers has control over the price of wheat.
Perfect competition is an ideal. No industry shows all its characteristics, but the stock market and some agricultural markets, such as those for wheat and corn, come closest. Farmers, for example, can sell all of their crops through national commodity exchanges at the current market price.
Pure Monopoly
At the other end of the spectrum is pure monopoly, the market structure in which a single firm accounts for all industry sales of a particular good or service. The firm is the industry. This market structure is characterized by barriers to entry—factors that prevent new firms from competing equally with the existing firm. Often the barriers are technological or legal conditions. Polaroid, for example, held major patents on instant photography for years. When Kodak tried to market its own instant camera, Polaroid sued, claiming patent violations. Polaroid collected millions of dollars from Kodak. Another barrier may be one firm’s control of a natural resource. DeBeers Consolidated Mines Ltd., for example, controls most of the world’s supply of uncut diamonds.
Public utilities, such as gas and water companies, are pure monopolies. Some monopolies are created by a government order that outlaws competition. The U.S. Postal Service is currently one such monopoly.
Monopolistic Competition
Three characteristics define the market structure known as monopolistic competition:
Many firms are in the market.
The firms offer products that are close substitutes but still differ from one another.
It is relatively easy to enter the market.
Under monopolistic competition, firms take advantage of product differentiation. Industries where monopolistic competition occurs include clothing, food, and similar consumer products. Firms under monopolistic competition have more control over pricing than do firms under perfect competition because consumers do not view the products as perfect substitutes. Nevertheless, firms must demonstrate product differences to justify their prices to customers. Consequently, companies use advertising to distinguish their products from others. Such distinctions may be significant or superficial. For example, Nike says “Just Do It,” and Tylenol is advertised as being easier on the stomach than aspirin.
Oligopoly
An oligopoly has two characteristics:
A few firms produce most or all of the output.
Large capital requirements or other factors limit the number of firms.
Boeing and Airbus Industries (aircraft manufacturers) and Apple and Google (operating systems for smartphones) are major players in different oligopolistic industries.
With so few firms in an oligopoly, what one firm does has an impact on the other firms. Thus, the firms in an oligopoly watch one another closely for new technologies, product changes and innovations, promotional campaigns, pricing, production, and other developments. Sometimes they go so far as to coordinate their pricing and output decisions, which is illegal. Many antitrust cases—legal challenges arising out of laws designed to control anticompetitive behavior—occur in oligopolies.
The market structure of an industry can change over time. Take, for example, telecommunications. At one time, AT&T had a monopoly on long-distance telephone service nationwide. Then the U.S. government divided the company into seven regional phone companies in 1984, opening the door to greater competition. Other companies such as MCI and Sprint entered the fray and built state-of-the-art fiber-optic networks to win customers from the traditional providers of phone service. The 1996 Telecommunications Act changed the competitive environment yet again by allowing local phone companies to offer long-distance service in exchange for letting competition into their local markets. Today, the broadcasting, computer, telephone, and video industries are converging as companies consolidate through mergers and acquisitions.
Concept Check
What is meant by market structure?
Compare and contrast perfect competition and pure monopoly. Why is it rare to find perfect competition?
How does an oligopoly differ from monopolistic competition?
Trends in the Business Environment and Competition
Learning Objectives
Which trends are reshaping the business, microeconomic, and macroeconomic environments and competitive arena?
Trends in the business and economic environment occur in many areas. As noted earlier, today’s workforce is more diverse than ever, with increasing numbers of minorities and older workers. Competition has intensified. Technology has accelerated the pace of work and the ease with which we communicate. Let’s look at how companies are meeting the challenges of a changing workforce, the growing demand for energy, and how companies are meeting competitive challenges.
Changing Workforce Demographics
As the baby boomer generation ages, so does the U.S. workforce. In 2010, more than 25 percent of all employees were retirement age. Fast forward to the U.S. labor force in 2017, however, and millennials have taken over the top spot in the labor market, with more than 40 percent of the total workforce. Although older workers are now retiring closer to the traditional retirement age of 65, many plan to keep working beyond 65, often into their 70s. No longer is retirement an all-or-nothing proposition, and older workers in the baby boomer generation are taking a more positive attitude toward their later years. A surprising number of Americans expect to work full- or part-time after “retirement,” and most would probably work longer if phased retirement programs were available at their companies. Financial reasons motivate most of these older workers, who worry that their longer life expectancies will mean outliving the money they saved for retirement, especially after retirement savings took a hit during the global recession of 2007–2009. For others, however, the satisfaction of working and feeling productive is more important than money alone.29
These converging dynamics continue to create several major challenges for companies today. And by 2020, additional generational shifts are projected to occur in the U.S. labor force, which will have an even bigger effect on how companies do business and retain their employees. Today’s workforce spans five generations: recent college graduates (Generation Z); people in their 30s and 40s (millennials and Generation X); baby boomers; and traditionalists (people in their 70s). It is not unusual to find a worker who is 50, 60, or even 70 working for a manager who is not yet 30. People in their 50s and 60s offer their vast experience of “what’s worked in the past,” whereas those in their 20s and 30s tend to be experimental, open to options, and unafraid to take risks. The most effective managers will be the ones who recognize generational differences and use them to the company’s advantage.30
Many companies have developed programs such as flexible hours and telecommuting to retain older workers and benefit from their practical knowledge and problem-solving skills. In addition, companies should continually track where employees are in their career life cycles, know when they are approaching retirement age or thinking about retirement, and determine how to replace them and their knowledge and job experiences.31
Another factor in the changing workforce is the importance of recognizing diversity among workers of all ages and fostering an inclusive organizational culture. According to a recent report by the U.S. Census Bureau, millennials are the largest generation in U.S. history, and more than 44 percent classify themselves as something other than “White.” In addition, women continue to make progress on being promoted to management, although their path to CEO seems to be filled with obstacles. Recent statistics suggest that fewer than 5 percent of Fortune 500 companies have female CEOs. The most successful organizations will be the ones that recognize the importance of diversity and inclusion as part of their ongoing corporate strategies.32
Managing Change
EY Makes Diversity and Inclusion a Top Priority
As older workers continue to leave the U.S. labor force and younger individuals begin work or move to other jobs to further their careers, businesses must recognize the importance of diversity and inclusion as key corporate strategies. This is particularly critical as multicultural millennials become the dominant group in the U.S. workforce. One leader in embracing diversity as an important part of corporate life is EY (formerly Ernst & Young), a global leader in assurance, tax, and advisory services.
EY believes its core values and business strategies are firmly based on diversity and inclusiveness, as evidenced by the company landing in the top spot of DiversityInc’s 2017 list of the top companies for diversity. This recognition for EY is no accident; the company has made diversity and inclusion key goals for its more than 214,000 employees around the world. With a diverse workforce becoming the norm, it is no longer acceptable for companies to simply hold a random seminar or two for their managers and employees to discuss diversity and inclusion in the workplace.
Karyn Twaronite, EY’s global diversity and inclusion officer, believes that a simple, ongoing approach is the most effective way to address diversity and inclusion in the workplace. The company uses a decision-making strategy called PTR, or preference, tradition, and requirement, to help managers think about diversity and inclusion. The strategy challenges managers to examine preferences toward job candidates who are similar to themselves, asks them whether their decision about hiring a specific candidate is influenced by traditional characteristics of a certain role, and urges them to make their selection based on the requirements of the job rather than on their personal preferences. In other words, the decision-making tool gives people a way to question the status quo without accusing colleagues of being biased.
Another way EY fosters inclusiveness is by sponsoring professional network groups within the organization. These groups provide members with opportunities to network across various EY divisions, create informal mentoring relationships, and strengthen leadership skills. Some of the established networks within EY include groups for LGBTQ employees; Black, Latino, and pan-Asian people; women; veterans; and employees with disabilities.
As a global company that works with clients in many countries, EY knows the importance of acknowledging different perspectives and cultures as part of its daily business. The company is committed to making sure employees as well as clients respect different viewpoints and individual differences, including background, education, gender, ethnicity, religious background, sexual orientation, ability, and technical skills. According to EY’s diversity web page, research shows that a company’s diverse teams are more likely to improve market share and have success in new markets and that they demonstrate stronger collaboration and better retention.
Questions for Discussion
How does EY’s approach to diversity and inclusion translate to additional revenues for the company?
Would a company’s commitment to diversity make a difference to you when interviewing for a job? Why or why not?
Sources: Company website, “A Diverse and Inclusive Workforce,” http://www.ey.com, accessed May 29, 2017; “DiversityInc Top 50: #1—EY: Why They’re on the List,” http://www.diversityinc.com, accessed May 29, 2017; “Founded on Inclusiveness; Strengthened by Diversity: A Place for Everyone,” http://exceptionaley.com, accessed May 29, 2017; Grace Donnelly, “Here’s EY’s Simple But Effective Strategy for Increasing Diversity,” Fortune, http://fortune.com, February 10, 2017.
Global Energy Demands
As standards of living improve worldwide, the demand for energy continues to rise. Emerging economies such as China and India need energy to grow. Their demands are placing pressure on the world’s supplies and affecting prices, as the laws of supply and demand would predict. For example, in recent years, China and India were responsible for more than half of the growth in oil products consumption worldwide. State-supported energy companies in China, India, Russia, Saudi Arabia, and other countries will place additional competitive pressure on privately owned oil companies such as BP, Chevron, ExxonMobil, and Shell.33
Countries worldwide worry about relying too heavily on one source of supply for energy. The United States imports a large percentage of its oil from Canada and Saudi Arabia. Europeans get 39 percent of their natural gas from Russia’s state-controlled gas utility OAO Gazprom.34 This gives foreign governments the power to use energy as a political tool. For example, continuing tensions between Russia and Ukraine in November 2015 caused Russia to stop sending natural gas to Ukraine, which also caused gas disruptions in Europe because Russia uses Ukraine’s pipelines to transport some of its gas deliveries to European countries. In 2017, Russia announced plans to build its own pipeline alongside Ukraine’s gas line in the Baltic Sea, which would allow Russia to bypass Ukraine’s pipelines altogether and deliver gas directly to European countries.35
Countries and companies worldwide are seeking additional sources of supply to prevent being held captive to one supplier. For example, the relatively new technology of extracting oil from shale rock formations in the United States (known as fracking) has helped create an important resource for the country’s oil industry. This innovative approach to finding new sources of energy now accounts for more than half of the country’s oil output, which can help reduce U.S. dependence on foreign oil and create new jobs.36
Meeting Competitive Challenges
Companies are turning to many different strategies to remain competitive in the global marketplace. One of the most important is relationship management, which involves building, maintaining, and enhancing interactions with customers and other parties to develop long-term satisfaction through mutually beneficial partnerships. Relationship management includes both supply chain management, which builds strong bonds with suppliers, and relationship marketing, which focuses on customers. In general, the longer a customer stays with a company, the more that customer is worth. Long-term customers buy more, take less of a company’s time, are less sensitive to price, and bring in new customers. Best of all, they require no acquisition or start-up costs. Good long-standing customers are worth so much that in some industries, reducing customer defections by as little as five points—from, say, 15 percent to 10 percent per year—can double profits.
Another important way companies stay competitive is through strategic alliances (also called strategic partnerships). The trend toward forming these cooperative agreements between business firms is accelerating rapidly, particularly among high-tech firms. These companies have realized that strategic partnerships are more than just important—they are critical. Strategic alliances can take many forms. Some companies enter into strategic alliances with their suppliers, who take over much of their actual production and manufacturing. For example, Nike, the largest producer of athletic footwear in the world, does not manufacture a single shoe.
Other companies with complementary strengths team up. For example, Harry’s Shave Club, an online men’s grooming subscription service, recently teamed up with retail giant Target to improve sales and boost its brand presence among Target shoppers. Harry’s products are now available in Target’s brick-and-mortar stores and on Target’s website as part of an exclusive deal that makes Target the only mass retailer to carry Harry’s grooming products. The men’s shaving industry accounts for more than $2.6 billion in annual sales.37
Concept Check
What steps can companies take to benefit from the aging of their workers and to effectively manage a multigenerational workforce?
Why is the increasing demand for energy worldwide a cause for concern?
Describe several strategies that companies can use to remain competitive in the global economy.
Key Terms
barriers to entry
Factors, such as technological or legal conditions, that prevent new firms from competing equally with an existing firm.
business
An organization that strives for a profit by providing goods and services desired by its customers.
business cycles
Upward and downward changes in the level of economic activity.
capital
The inputs, such as tools, machinery, equipment, and buildings, used to produce goods and services and get them to the customer.
capitalism
An economic system based on competition in the marketplace and private ownership of the factors of production (resources); also known as the private enterprise system.
circular flow
The movement of inputs and outputs among households, businesses, and governments; a way of showing how the sectors of the economy interact.
communism
An economic system characterized by government ownership of virtually all resources, government control of all markets, and economic decision-making by central government planning.
consumer price index (CPI)
An index of the prices of a “market basket” of goods and services purchased by typical urban consumers.
contractionary policy
The use of monetary policy by the Fed to tighten the money supply by selling government securities or raising interest rates.
cost-push inflation
Inflation that occurs when increases in production costs push up the prices of final goods and services.
costs
Expenses incurred from creating and selling goods and services.
crowding out
The situation that occurs when government spending replaces spending by the private sector.
cyclical unemployment
Unemployment that occurs when a downturn in the business cycle reduces the demand for labor throughout the economy.
demand
The quantity of a good or service that people are willing to buy at various prices.
demand curve
A graph showing the quantity of a good or service that people are willing to buy at various prices.
demand-pull inflation
Inflation that occurs when the demand for goods and services is greater than the supply.
demography
The study of people’s vital statistics, such as their age, gender, race and ethnicity, and location.
economic growth
An increase in a nation’s output of goods and services.
economic system
The combination of policies, laws, and choices made by a nation’s government to establish the systems that determine what goods and services are produced and how they are allocated.
economics
The study of how a society uses scarce resources to produce and distribute goods and services.
entrepreneurs
People who combine the inputs of natural resources, labor, and capital to produce goods or services with the intention of making a profit or accomplishing a not-for-profit goal.
equilibrium
The point at which quantity demanded equals quantity supplied.
expansionary policy
The use of monetary policy by the Fed to increase, or loosen, the growth of the money supply.
factors of production
The resources used to create goods and services.
federal budget deficit
The condition that occurs when the federal government spends more for programs than it collects in taxes.
Federal Reserve System (the Fed)
The central banking system of the United States.
fiscal policy
The government’s use of taxation and spending to affect the economy.
frictional unemployment
Short-term unemployment that is not related to the business cycle.
full employment
The condition when all people who want to work and can work have jobs.
goods
Tangible items manufactured by businesses.
gross domestic product (GDP)
The total market value of all final goods and services produced within a nation’s borders each year.
inflation
The situation in which the average of all prices of goods and services is rising.
knowledge
The combined talents and skills of the workforce.
knowledge workers
Workers who create, distribute, and apply knowledge.
macroeconomics
The subarea of economics that focuses on the economy as a whole by looking at aggregate data for large groups of people, companies, or products.
market structure
The number of suppliers in a market.
microeconomics
The subarea of economics that focuses on individual parts of the economy, such as households or firms.
mixed economies
Economies that combine several economic systems; for example, an economy where the government owns certain industries but others are owned by the private sector.
monetary policy
A government’s programs for controlling the amount of money circulating in the economy and interest rates.
monopolistic competition
A market structure in which many firms offer products that are close substitutes and in which entry is relatively easy.
national debt
The accumulated total of all of the federal government’s annual budget deficits.
not-for-profit organization
An organization that exists to achieve some goal other than the usual business goal of profit.
oligopoly
A market structure in which a few firms produce most or all of the output and in which large capital requirements or other factors limit the number of firms.
perfect (pure) competition
A market structure in which a large number of small firms sell similar products, buyers and sellers have good information, and businesses can be easily opened or closed.
producer price index (PPI)
An index of the prices paid by producers and wholesalers for various commodities, such as raw materials, partially finished goods, and finished products.
productivity
The amount of goods and services one worker can produce.
profit
The money left over after all costs are paid.
purchasing power
The value of what money can buy.
pure monopoly
A market structure in which a single firm accounts for all industry sales of a particular good or service and in which there are barriers to entry.
quality of life
The general level of human happiness based on such things as life expectancy, educational standards, health, sanitation, and leisure time.
recession
A decline in GDP that lasts for at least two consecutive quarters.
relationship management
The practice of building, maintaining, and enhancing interactions with customers and other parties to develop long-term satisfaction through mutually beneficial partnerships.
revenue
The money a company receives by providing services or selling goods to customers.
risk
The potential to lose time and money or otherwise not be able to accomplish an organization’s goals.
savings bonds
Government bonds issued in relatively small denominations.
seasonal unemployment
Unemployment that occurs during specific seasons in certain industries.
services
Intangible offerings of businesses that can’t be held, touched, or stored.
socialism
An economic system in which the basic industries are owned either by the government itself or by the private sector under strong government control.
standard of living
A country’s output of goods and services that people can buy with the money they have.
strategic alliance
A cooperative agreement between business firms; sometimes called a strategic partnership.
structural unemployment
Unemployment that is caused by a mismatch between available jobs and the skills of available workers in an industry or region; not related to the business cycle.
supply
The quantity of a good or service that businesses will make available at various prices.
supply curve
A graph showing the quantity of a good or service that businesses will make available at various prices.
technology
The application of science and engineering skills and knowledge to solve production and organizational problems.
unemployment rate
The percentage of the total labor force that is not working but is actively looking for work.
Summary of Learning Objectives
1.1The Nature of Business
How do businesses and not-for-profit organizations help create our standard of living?
Businesses attempt to earn a profit by providing goods and services desired by their customers. Not-for-profit organizations, though not striving for a profit, still deliver many needed services for our society. Our standard of living is measured by the output of goods and services. Thus, businesses and not-for-profit organizations help create our standard of living. Our quality of life is not simply the amount of goods and services available for consumers but rather the society’s general level of happiness.
Economists refer to the building blocks of a business as the factors of production. To produce anything, one must have natural resources, labor (human resources), capital, and entrepreneurship to assemble the resources and manage the business. Today’s competitive business environment is based upon knowledge and learning. The companies that succeed will be those that learn fast, use knowledge efficiently, and develop new insights.
1.2Understanding the Business Environment
What are the sectors of the business environment, and how do changes in them influence business decisions?
The external business environment consists of economic, political and legal, demographic, social, competitive, global, and technological sectors. Managers must understand how the environment is changing and the impact of those changes on the business. When economic activity is strong, unemployment rates are low, and income levels rise. The political environment is shaped by the amount of government intervention in business affairs, the types of laws it passes to regulate both domestic and foreign businesses, and the general political stability of a government. Demographics, or the study of people’s vital statistics, are at the heart of many business decisions. Businesses today must deal with the unique preferences of different generations, each of which requires different marketing approaches and different goods and services. The population is becoming increasingly diverse: currently, minorities represent more than 38 percent of the total U.S. population, and that number will continue to increase over the next several decades. Minorities’ buying power has increased significantly as well, and companies are developing products and marketing campaigns that target different ethnic groups. Social factors—our attitudes, values, and lifestyles—influence what, how, where, and when people purchase products. They are difficult to predict, define, and measure because they can be very subjective. They also change as people move through different life stages.
1.3How Business and Economics Work
What are the primary features of the world’s economic systems, and how are the three sectors of the U.S. economy linked?
Economics is the study of how individuals, businesses, and governments use scarce resources to produce and distribute goods and services. Today there is a global trend toward capitalism. Capitalism, also known as the private enterprise system, is based upon marketplace competition and private ownership of the factors of production. Competition leads to more diverse goods and services, keeps prices stable, and pushes businesses to become more efficient.
In a communist economy, the government owns virtually all resources, and economic decision-making is done by central government planning. Governments have generally moved away from communism because it is inefficient and delivers a low standard of living. Socialism is another centralized economic system in which the basic industries are owned by the government or by the private sector under strong government control. Other industries may be privately owned. The state is also somewhat influential in determining the goals of business, the prices and selection of products, and the rights of workers. Most national economies today are a mix of socialism and capitalism.
The two major areas in economics are macroeconomics, the study of the economy as a whole, and microeconomics, the study of households and firms. The individual, business, and government sectors of the economy are linked by a series of two-way flows. The government provides public goods and services to the other two sectors and receives income in the form of taxes. Changes in one flow affect the other sectors.
1.4Macroeconomics: The Big Picture
How do economic growth, full employment, price stability, and inflation indicate a nation’s economic health?
A nation’s economy is growing when the level of business activity, as measured by gross domestic product (GDP) is rising. GDP is the total value of all goods and services produced in a year. The goal of full employment is to have a job for all who can and want to work. How well a nation is meeting its employment goals is measured by the unemployment rate. There are four types of unemployment: frictional, structural, cyclical, and seasonal. With price stability, the overall prices of goods and services are not moving very much either up or down. Inflation is the general upward movement of prices. When prices rise, purchasing power falls. The rate of inflation is measured by changes in the consumer price index (CPI) and the producer price index (PPI). There are two main causes of inflation. If the demand for goods and services exceeds the supply, prices will rise. This is called demand-pull inflation. With cost-push inflation, higher production costs, such as expenses for materials and wages, increase the final prices of goods and services.
1.5Achieving Macroeconomic Goals
How does the government use monetary policy and fiscal policy to achieve its macroeconomic goals?
Monetary policy refers to actions by the Federal Reserve System (the Fed) to control the money supply. When the Fed restricts the money supply, interest rates rise, the inflation rate drops, and economic growth slows. By expanding the money supply, the Fed stimulates economic growth. The government also uses fiscal policy— changes in levels of taxation and spending—to control the economy. Reducing taxes or increasing spending stimulates the economy; raising taxes or decreasing spending does the opposite. When the government spends more than it receives in tax revenues, it must borrow to finance the deficit. Some economists favor deficit spending as a way to stimulate the economy; others worry about our high level of national debt.
1.6Microeconomics: Zeroing in on Businesses and Consumers
What are the basic microeconomic concepts of demand and supply, and how do they establish prices?
Demand is the quantity of a good or service that people will buy at a given price. Supply is the quantity of a good or service that firms will make available at a given price. When the price increases, the quantity demanded falls, but the quantity supplied rises. A price decrease leads to increased demand but a lower supply. At the point where the quantity demanded equals the quantity supplied, demand and supply are in balance. This equilibrium point is achieved by market adjustments of quantity and price.
1.7Competing in a Free Market
What are the four types of market structure?
Market structure is the number of suppliers in a market. Perfect competition is characterized by a large number of buyers and sellers, very similar products, good market information for both buyers and sellers, and ease of entry into and exit from the market. In a pure monopoly, there is a single seller in a market. In monopolistic competition, many firms sell close substitutes in a market that is fairly easy to enter. In an oligopoly, a few firms produce most or all of the industry’s output. An oligopoly is also difficult to enter, and what one firm does will influence others.
1.8Trends in the Business Environment and Competition
Which trends are reshaping the business, microeconomic, and macroeconomic environments and competitive arena?
To remain competitive, businesses must identify and respond to trends in the various sectors of the business environment. As the population ages, large numbers of baby boomers are approaching retirement age. Companies must plan for this exodus of employees and find ways to retain the vast amounts of knowledge they represent. Many older workers are choosing to continue working after traditional retirement age, creating a five-generation workforce. Worldwide demand for energy, especially from China and India, is challenging oil companies to increase supplies or to find alternative technologies to produce more oil, such as fracking. U.S. vulnerability to disruptions in energy supply became painfully apparent when Hurricane Katrina put Gulf Coast refineries and offshore drilling rigs out of commission. Companies are using relationship management and strategic alliances to compete effectively in the global economy.
Preparing for Tomorrow’s Workplace Skills
Select a not-for-profit organization whose mission interests you. What are the organization’s objectives? What resources does it need to achieve those goals? Select a for-profit business that provides a similar service, and compare the two organizations. How does each use the factors of production? (Resources, Information, Systems)
Team Activity: Form seven teams. Each team is responsible for one of the sectors of the external business environment discussed in the chapter (economic, political/legal, demographic, social, competitive, global, and technological). Your boss, the company president, has asked each team to report on the changes in that area of the external environment and how they will affect the firm over the next five years. The firm is the Boeing Company. Each team should use the library, the internet, and other data sources to make its projections. Each team member should examine at least one data source. The team should then pool the data and prepare its response. A spokesperson for each team should present the findings to the class. (Interpersonal, Resources, Information)
If a friend claimed, “Economics is all theory and not very practical,” how might you counter this claim? Share your rationale with the class. (Interpersonal, Information)
Team Activity: Create two teams of four people each. Have one side choose a communist economy and the other capitalism. Debate the proposition that “capitalism/a command economy is good for developing nations.” (Interpersonal, Information)
What are the latest actions the federal government has taken to manage the economy? Has it used monetary policy or fiscal policy to achieve its macroeconomic goals? Summarize your findings. Choose one of the following industries, and discuss how the government’s actions will affect that industry: airlines, automobile manufacturers, banking, biotechnology, chemical manufacturing, home building, oil and gas, retail stores, and telecommunication services. (Information, Systems)
As a manufacturer of wireless headphones, you are questioning your pricing policies. You note that over the past five years, the CPI increased an average of 3 percent per year but that the price of a pair of wireless headphones increased an average of 8 percent per year for the first three years and 2 percent per year for the next two years. What does this information tell you about demand, supply, and other factors influencing the market for these headphones? (Resources, Information)
Ethics Activity
Historically, diesel cars have not been big sellers in the U.S. auto market, mainly because their engines couldn’t pass the strict emissions standards set up by the Environmental Protection Agency and the California Air Resources Board. But that all changed in 2005, when German automaker Volkswagen made a decided push to develop “clean diesel” engines, specifically manufactured to meet strict U.S. emissions standards.
By 2010, VW had introduced several models of diesel cars in the United States, and their sales helped propel Volkswagen to the number-two slot in global auto sales, after Toyota and ahead of GM. While VW was receiving major media attention for its clean diesel models, researchers from West Virginia University discovered that these so-called clean engines had been constructed with a “defeat device”—software that could actually tell when the car was being tested off road for emissions and lower the level of emissions that harm the environment.
By December 2014, Volkswagen agreed to voluntarily recall more than a half-million clean diesel cars in the United States to address the emissions issues. But the scandal continued to escalate, with accusations that senior management knew about the rigged engines, and VW’s CEO resigned and several other executives were fired.
Class-action lawsuits and other litigation followed, and in April 2017, VW agreed to a $4.3 billion settlement, which included a criminal fine of $2.8 billion, as well as various buyback plans for the affected diesel cars. In addition, over the last several years, VW has experienced a significant decline in U.S. sales and is now trying to win back customers.
Using a web search tool, locate information about this topic, and then write responses to the following questions. Be sure to support your arguments and cite your sources.
Ethical Dilemma: How can VW ensure that its diesel cars now comply with U.S. emissions standards? What can VW do to regain consumers’ confidence after this worldwide scandal? Do you agree with the billions of dollars in fines that VW will have to pay to move beyond the emissions debacle?
Sources: “VW Diesel Crisis: Timeline of Events,” https://www.cars.com, May 19, 2017; Jack Ewing, “Inside VW’s Campaign of Trickery,” The New York Times, http://www.nytimes.com, May 7, 2017; Christoph Rauwald, “How a Top-Secret Deal Could Have Stopped VW’s Diesel Scandal,” Bloomberg, http://www.bloomberg.com, January 12, 2017; “6 VW Execs Indicted as Carmaker Agrees to $4.3 Billion Diesel Cheat Settlement,” Fortune, http://fortune.com, January 12, 2017; Geoffrey Smith and Roger Parloff, “Hoaxwagen: Inside Volkswagen’s Diesel Fraud,” Fortune, http://fortune.com, March 7, 2016.
Working the Net
The Bureau of Labor Statistics compiles demographic data. Visit http://www.bls.gov/bls/demographics.htm, and describe the different types of information it provides. What kinds of changes are likely to occur in the United States over the next 25 years? Click on Spending & Time Use and select How Americans Spend Time to read about the American Time Use Survey. What trends can you identify?
Go to either the Red Herring (http://www.redherring.com) or Wired (http://www.wired.com) site and research technology trends. Compile a list of three trends that sound most promising to you, and describe them briefly. How will they affect businesses? What impact, if any, will they have on you personally?
Use the Bureau of Labor Statistics site (http://stat.bls.gov) to determine the current trends in GDP growth, unemployment, and inflation. What do these trends tell you about the level of business activity and the business cycle? If you owned a staffing agency, how would this information affect your decision-making?
What’s the latest U.S. economic news? Go to the CNBC website, and select the Economy page, which categorizes news about the world economy, the U.S. economy, and other important topics (http://www.cnbc.com/economy/). Read the various articles about the U.S. economy, and then do the same for GDP Outlook. Prepare a summary of what you learned, and use it to discuss where you think the economy is headed for the next 6 to 12 months.
How would you spend the national budget if you were president? Here’s your chance to find out how your ideas would affect the federal budget. Go online to Committee for a Responsible Federal Budget, at http://www.crfb.org, and under Tools, click on Stabilize the Debt, which is an exercise in making difficult decisions and how government officials make trade-offs when they prepare the federal budget. Experiment with your own budget ideas at the site. What are the effects of your decisions?
Critical Thinking Case
Walmart Gets Serious about E-Commerce
As the world’s largest retailer, Walmart has built thousands of brick-and-mortar stores in the United States, Mexico, and elsewhere. Although a success story when it comes to traditional retail locations, Walmart has struggled with its e-commerce efforts, with recent online sales accounting for about 3 percent of the company’s $300 billion in annual sales. Online sales for Walmart started trending upward in 2020, and in 2021, the company held 7.2% of all online sales in the United States. The company has tried several different e-commerce strategies in the past, but none of them was an overwhelming success. Some company insiders objected to the pricing strategy used for online purchases; they were fearful that Walmart’s lower prices online would take customers (and sales) away from the retail locations.
Doug McMillon, Walmart’s CEO since 2014, believed a significant change was needed in the company’s e-commerce business, and he recently made changes in a big way. Over the past two years, Walmart spent billions to acquire several online companies to expand its e-commerce business in an effort to take a small bite out of retail giant Amazon’s success. In 2016, Walmart purchased Jet.com, an e-commerce site that sells a little bit of everything (books, clothing, electronics, etc.) at discount prices. Once the $3 billion acquisition was completed, Jet’s cofounder and CEO, Marc Lore, who now runs Walmart’s e-commerce platform, worked with McMillon to identify other established online companies to add to their e-commerce portfolio, and add they did.
First Walmart purchased footwear e-tailer ShoeBuy for $70 million in January 2017. The following month, Walmart bought outdoor specialty retailer Moosejaw for $51 million. Then in March, Walmart paid $75 million for ModCloth, an eclectic shopping site for women’s fashions. In 2017, Walmart purchased Bonobos, a hip fashion retailer geared to millennial males, for $310 million.
Reaction to the acquisitions has been mixed, depending on whom you ask. Retail analysts applaud the company’s radical move, pointing out that several well-known traditional retailers have closed their doors or filed for bankruptcy because they failed to take part in the e-commerce revolution. Fashionistas, on the other hand, are lukewarm about the move. However, McMillon’s decision to allow the online retailers to operate independently may help retain loyal customers. The new e-commerce strategy may also lure typical in-store shoppers to take advantage of the expanded offerings available through both Walmart.com and Jet.com.
Critical Thinking Questions
What are some advantages of Walmart purchasing established web businesses?
What impact is Walmart’s acquisition of nontraditional retailers likely to have on the shopping habits of Walmart’s customers?
How will the aggressive e-commerce plan implemented by Walmart affect operations at its retail locations?
Sources: Rimma Kats, “Walmart maintains ecommerce momentum with sales rising by 26/4% this year,” Insider Intelligence, June 24, 2021; Brad Stone and Matthew Boyle, “Amazon Won’t Know What Hit ’Em!” Bloomberg Businessweek, http://www.bloomberg.com, May 8–May 14, 2017; “What an Acquisition of Bonobos Would Signal About Wal-Mart’s Strategy,” Forbes, http://www.forbes.com, May 9, 2017; “Walmart Acquires Niche Online Retailers, to the Dismay of Hipsters,” Denver Post, http://www.denverpost.com, March 24, 2017; Alana Abramson, “Walmart Acquires Online Women’s Retailer ModCloth,” Fortune, http://fortune.com, March 17, 2017; Phil Wahba, “Walmart’s 29% Online Holiday Season Growth Sends Shares Jumping,” Fortune, http://fortune.com, February 21, 2017; Laura Heller, “Take That Amazon: Walmart Buys Moosejaw for $51 Million,” Forbes, http://www.forbes.com, February 15, 2017; “Walmart Acquires ShoeBuy for $70 Million,” Business Insider, http://www.businessinsider.com, January 6, 2017.
Hot Links Address Book
What makes a company good to work for or most admired? Find out by checking Fortune’s special lists at http://www.fortune.com.
Which country has the largest GDP? The most people? The answers can be found in The World Factbook at https://www.cia.gov.
Get the scoop on the latest technology trends affecting our lives from CNET’s website at http://www.cnet.com. The site also includes product reviews, how-to videos, and smart home features.
The Federal Reserve Board issues a variety of statistical information about the state of the U.S. economy. Find it at the Federal Reserve’s site by clicking on the Economic Research and Data links: http://www.federalreserve.gov.
Want to know the current public debt per citizen, or even what it was in 1790? Go to https://www.transparency.treasury.gov/ and click on National Debt.
The U.S. Bureau of Economic Analysis (BEA) tracks national and regional economic statistics, including the GDP. To find the latest GDP statistics, visit the BEA at.
How are the job prospects in your area? Your region’s unemployment statistics can give you an idea of how hard it will be to find a job. Find the most recent unemployment statistics from the Bureau of Labor Statistics at http://www.bls.gov.
Let’s Test Your Knowledge
http://Environmental Defense Fund, “Seven Years Later: What’s Ahead for the Gulf,” http://www.edf.org, accessed May 15, 2017; “Oil Spills Fast Facts,” CNN, http://www.cnn.com, February 9, 2017; Steven Mufson, “BP’s Big Bill for the World’s Largest Oil Spill Reaches $61.6 Billion,” Washington Post, https://www.washingtonpost.com, July 14, 2016; Debbie Elliott, “5 Years after BP Oil Spill, Effects Linger and Recovery Is Slow,” NPR, http://www.npr.org, April 20, 2015; https://theconversation.com/amp/bp-paid-a-steep-price-for-the-gulf-oil-spill-but-for-the-us-a-decade-later-its-business-as-usual-136905 ↵