Database Software 3: Creating Reports and Forms
Creating Reports and Forms
Jennifer Lavergne

Learning Objectives
- Use the Form Wizard
- Format forms in Layout View
- Create reports using the Report Tool
- Preview and print reports
LEARN IT

FORMS AND REPORTS
Database software has many tools available that allow a programmer to create user interfaces and formatted documents. The user interfaces, also known as forms, allow the user to enter data into the database. Forms are user friendly and have an easy-to-follow layout so the user knows exactly where each data point should go.
Formatted documents are a way to convert data into information. This information then can be displayed in a coherent manner. These are also known as reports and can be tailored to a user’s preferences.
DATABASE FORMS
The image below shows a basic user interface form that will take the user’s entries as input. The input will then be stored in the student table we saw before.
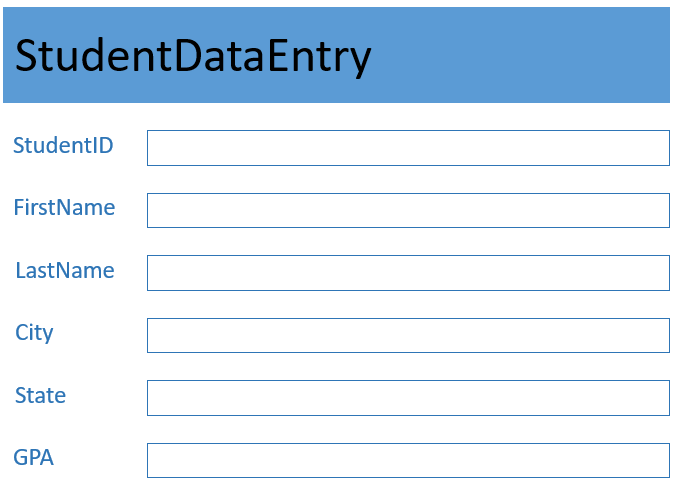
The user enters into each textbox the information needed, then submits the form. The database system then takes the contents of each and maps it to its corresponding field in the database. We, as the developer, indicate where each textbox’s data will be stored. Automating data storage can make data entry less time consuming and error prone.
|
Student Information |
Maps to |
Student Table |
|
|
First Name |
Zabby |
→ |
FirsName |
|
Last Name |
Boudreaux |
→ |
LastName |
|
City |
New Orleans |
→ |
City |
|
State |
LA |
→ |
State |
|
Zip Code |
70032 |
→ |
Zip |
|
Major |
BIO |
→ |
Major |
|
Class |
JR |
→ |
Class |
|
GPA |
3.98 |
→ |
GPA |
Forms allows the user to add data to the database table without interacting directly with the table itself. This is desirable, first and foremost, because we do not want to add anything to our table we have not made sure is correct. For example, a user should not be able to add a city name in the zip code field. We also might want to make sure the GPA entered is between 0.00 and 4.00. This allows us to ensure the integrity of our data. Meaning, when a user looks for a zip code, they are guaranteed to only see zip codes.
DATABASE REPORTS
Once we have entered our data in our table via our form, we can then generate a report. A report queries the data from a table or tables and formats it in an easy-to-consume manner. Any time you search for something on the internet you are seeing a report.
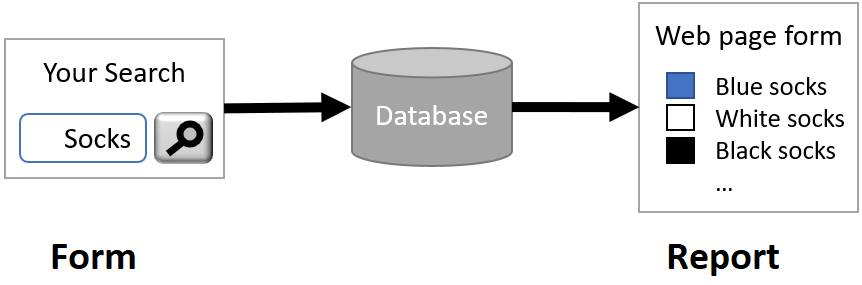
If one searches for socks on a clothing site and then clicks on the search button, the website then sends a query for socks to the database. The database uses the query to find all matching records with your search and sends them back to the webpage. The page then displays a report showing these results, formatted in an intuitive manner. A report using our Students table could display all students, all students who are seniors, or all students who are seniors and have a high GPA. It’s based upon the user’s needs.
As the developer, we have many options for organizing and formatting a report. Most report creation software offers a plethora of different tools, colors, and options to format a report however your user requests it. Below is an example of a report with student GPAs sorted in ascending order.
|
Student GPA Report |
||
|
First Name |
Last Name |
GPA |
|
Jossef |
Goldberg |
4.0 |
|
Terri |
Duffy |
3.98 |
|
Roberto |
Tamburello |
3.85 |
|
Ken |
Sánchez |
3.65 |
Note that it’s possible for there to be many more records than this in a real-world report. In this case it would be useful to decide how many to display at one time and make separate reports for each list. This way the user can “flip” through the ‘pages’ of the report and see a limited number of records on each “page.”
DATABASE PRACTICE 4

Prefer to watch and learn? Check out this video tutorial:
Complete the following Practice Activity and submit your completed project.
For Practice 4, we will continue to work with the same database that manages student and faculty data in the honors program at South Puget Sound Community College. For this practice, we will focus on creating reports for the database. We will create four reports:
- Student Contact Information
- Student Scholarships
- Faculty Contact Information
- Faculty Division Listing
Open Access, and under Open, select the database Lastname_Firstname_Access_Practice3. You may need to browse to your flash drive or other location that you saved this database to. In Backstage view, select Save As, and save the database as Lastname_Firstname_Access_Practice4. Ensure the database is saved on your flash drive or another safe location.
- If necessary, select Enable Content to show all of the database content.
- Ensure the navigation pane is open and all database objects are displayed.
- On the Create tab, in the Reports group, notice there are several ways to create a report. We will focus on the following:
-
- Report
- Report Wizard
- In the navigation pane, select the Students table, but do not open it. On the Create tab, in the reports group, select Report. This will create a report with all of the fields on the Students table. We will modify this report to provide Student Contact Information.
- You can close the navigation pane to allow more room to view the report. Notice that the Students report opens in Layout View. The Report Layout Tools contain four tabs:
-
- Design
- Arrange
- Format
- Page Setup
- Select the Student ID label. It should be the first column of the report. On the Report Layout Tools, Arrange Tab, in the Rows & Columns group, select Select Column. Then press the Delete key on your keyboard to delete the entire column. Notice how the other columns shift automatically.
- Select the Field of Interest label, then select the entire column. Right-click and select Delete Column.
- Use either one of the techniques you just learned to delete the following columns:
-
- Graduation Year
- Faculty ID
- Scholarship
- The only remaining columns should be Last Name, First Name, and E-Mail.
- On the Design tab, in the Themes group, select the Office theme. Under Colors, select Blue. Under Fonts, select Arial.
- Scroll to the bottom of the report, and delete the page count textbox.
- At the top of the report, double-click the title Students. Remove the text inside the label and type Student Contact Information.
- Save the report as Student Contact Information and close it. Notice how the report shows up in the Navigation Pane under Reports.
- On the Create tab, in the Reports group, select Report Wizard.
- In the Report Wizard dialog box, under Tables/Queries, select the Query: Scholarships Awarded.
- Select all of the available fields by clicking the double arrow and moving them to the selected fields. Last Name, First Name, and Scholarship should all be in the Selected fields box. Select Next.
- Do not add any grouping levels, and select Next.
- Add an ascending sort on the Last Name field and then an ascending sort on the First Name field and then select Next.
- For the report layout, select Justified, and portrait orientation. Check the box to Adjust the field width so all fields fit on a page. Select Next.
- Title your report Student Scholarships, and preview the report. Select Finish.
- Notice that the report opens in Print Preview. Use the scroll bar at the bottom of the page to scroll through all 6 pages of the report.
- Close the Print Preview. You may also want to close the Navigation pane so that you have more space to work with the report.
- Ensure the report is in Design View. Notice there are several sections to this report:
-
- Report Header
- Page Header
- Detail
- Page Footer
- Report Footer
- In the Report Header section, double-click inside the title Student Scholarships. Remove the text and type Honors Program Scholarship Awardees.
- Turn on the Property Sheet. In the detail section, select the Last Name textbox. Take care not to choose the label. The textbox has a control source of Last Name. With the Last Name textbox selected, on the format tab of the property sheet, change the height to .4″ and press enter.
- Select the First Name textbox. Take care not to choose the label. The textbox has a control source of First Name. With the Last Name textbox selected, on the format tab of the property sheet, change the height to .4″ and press enter.
- In the detail section, select Scholarship and then press delete on your keyboard. Select the checkbox underneath, and press delete on your keyboard.
- Resize the Detail section by selecting the outer box and dragging up about an inch to remove any excess space in the detail section of the report. Save and close the report.
- On the Create tab, in the Reports Group, select Report Wizard. We will use the Report Wizard to write a report that provides Faculty Contact Information. In the Report Wizard dialog box, select the Table: Faculty.
- In the Available Fields, select Last Name, First Name, and E-Mail, and move these to the Selected Fields by using the single arrow, or double-clicking each field. Select Next.
- Do not add any grouping levels, and select Next.
- Add an Ascending sort to the Last Name field, and then an Ascending sort to the First Name field. Select Next.
- Choose the Tabular Report Layout with Portrait orientation. Check the box to Adjust the field width so all fields fit on a page.
- Title the report Faculty Contact Information, and preview the report. Select Finish.
- Take a moment to view the report in Print Preview and scroll through both pages of the report. Close the Print Preview.
- Open the Faculty Contact Information report in Design View.
- In the Report Header, change the title label to Honors Faculty E-Mail Addresses and manually center the title across the report page.
- Resize the Report Header so there is about an inch of extra space under the title.
- In the empty space under the report title, on the Design tab, in the Controls group, select Insert Image. Browse to find the image Access_Practice_4_Puma, which should be located in your data files.
- Click once, or drag and drop to insert the image of the Puma in the Report Header. Center the Puma image under the report title.
- In the Page Header, change the Label that reads E-Mail to say Faculty E-Mail Address*. Be sure to include the asterisk.
- Select and Drag the line below the Report Footer to create about an inch of space in the Report Footer. You can also right-click on the Report Footer, select Properties, and in the Property Sheet change the Height to 1″.
- On the Report Design Tools, Design Tab, in the Controls group, select Label. Click in the Report Footer to add the Label. Inside the Label type: *If a faculty email is missing from this report, please contact HR@spscc.edu.
- Save and close the Faculty Contact Information Report.
- For our final report, we will use the Report Tool to create a report that provides the Faculty Division Listing. Select, but do not open the Faculty table. On the Create tab, in the Report Group, select Report. You may close the Navigation pane to allow more room to work on the report.
- With the report in layout view, on the Report Layout Tools, Design Tab, in the Grouping Totals group, turn on the Group & Sort by clicking it one time. The Group, Sort, and Total dialog box will display at the bottom of the page.
- In the Group, Sort, and Total section, select Add a group. In the Select a field box, select Division. Notice how the report now groups faculty based on the division they work in. Click More, and select the option to keep the whole group together on one page. Close the Group, Sort, and Total pane by clicking the X to Close Grouping Dialog Box. Take care not to remove the group that was just added.
- Select the Faculty ID label, right-click, and select Delete Column. Use the same process to delete the E-Mail column.
- Select the title of the report that reads Faculty. Change the report title to Faculty Division Listing.
- Change the Report View to Design View. In the Report Header, select and delete the auto logo, which looks like an image of a book.
- Right-click on the Report Header, and select Fill/Back Color. Choose a light gray color from the first column. Ensure you can still see the text after the fill color is applied.
- In the Page Header, select the Division Label. On the Report Design Tools, Format Tab, in the Font group, select the arrow next to Background color. Under Theme Colors, select White, Background 1, Darker, 15%. Apply the same background color to the Division textbox in the Division Header.
- In the Page Footer, delete the page number count by selecting it and then pressing delete on your keyboard.
- In the Report Footer, add a label control and then type: “Please e-mail HR@maricopa.edu with any changes to this report.” Resize the label control if necessary to ensure all of the words display.
- In layout view, select the Division label, right-click, and select the entire column. Select the right outer edge of the column and drag it to the left until the column is about 2.5″ wide. Another option is to turn in the property sheet, Format Tab, and verify the width is 2.5″.
- Change the view of the report to Print Preview. In the lower right-hand corner, use the zoom scroll bar to zoom in and out of the report. Then, use the Page arrows to view all pages of the report. Ensure extra blank pages will not be printed, and make any modifications to your report as necessary.
- Save the report as Faculty Division Listing and Close all open database objects. Ensure all database objects are closed and the Navigation Pane is open and displays All Access Objects.
- Take a moment to verify you have the following database objects in your database.
-
- Tables
- Faculty
- Students
- Queries
- Health Sciences Students
- Honors Program Faculty and Students
- Honors Student List
- Scholarships Awarded
- Students Missing Field of Interest
- Forms
- Faculty
- Students
- Reports
- Faculty Contact Information
- Faculty Division Listing
- Student Contact Information
- Student Scholarships
- Tables
- To exit out of the database, first close any database objects that are open. Select the File tab, and take note of where your database is saved. Then select close. Then, exit out of Access.
Submit your entire database for grading per your instructor’s instructions.
MASTER ACTIVITY 1

Complete the following Master Activity and submit your completed project.
Exporting an Access report to Word and editing in Google Docs
As a student at SPSCC, you should already have a Google Account. You will need to be logged into your Google account to complete this assignment.

Since Google Docs is web based, it changes frequently. The steps outlined here may be slightly different from what you see on your screen. If you do not already have a Google account, you will need to create one. Go to http://google.com and in the upper right corner, click Sign In. On the Sign In screen, click Create Account. On the Create your Google Account page, complete the form, read and agree to the Terms of Service and Privacy Policy, and then click Next step. On the Welcome screen, click Get Started.
For this assignment, we will use Access to export a report to Microsoft Word, upload the Word document to OneDrive, and then edit the report in Google Docs.
- From the desktop, open your browser, navigate to http://google.com, and then sign in to your Google account. In the upper right corner of your screen, click Google apps, and then click Drive. If you are already logged into your Google Apps Account, click Apps, then Drive.
- Navigate to where your date files are stored, and open your Practice 4 database. If necessary, enable content.
- Ensure the navigation pane is open, and all access objects are shown. Click once to select the Faculty Contact Information report. Select it, but do not open it.
- On the External Data tab, in the Export group, select More, then choose Word.
- In the Export-RTD file dialog box, click Browse, and then navigate to where you save your files. In the File, Save as Dialog, click in the File Name box, type YourLastName_YourFirstName_Faculty_Contact_Information, and then Save. In the Export-RTF File dialog box, select Open the destination file after export operation is complete button and then click OK.
- Notice how Word opens with the exported report data. In Backstage view of the Word doc, verify the location where your Word doc is saved. Under Save As, notice you may have the option to save your document to OneDrive or Sites. Do not save your file here yet; rather, we will upload the Word document through Google.
- Close Microsoft Word, and Close the Access Database.
- From your Google Account, click the Apps Menu, and then click Drive. In Google Drive, click New in the upper left-hand corner, select Folder, and title the folder Access Reports.
- In the upper right-hand corner of your Google Drive window, click Settings, and then on the menu, select settings again. In the Settings dialog box, next to Convert Uploads, ensure the checkbox next to Convert uploaded files to Google Docs editor format is selected. Click Done to close the Settings dialog box.
- Click New in the upper left-hand corner, and then select File Upload. In the File Upload dialog box, navigate to where your files are stored, and locate the Faculty Contact Information Word document. Select the document, and then press upload. Double-click the file to open it in Google Docs.
- In Google Docs, notice how E-Mail has a red wavy line under it. Right-click in E-Mail, and select Add E-Mail to the dictionary.
- Select the entire report title and apply Bold and Underline. This is found on the Format tab.
- Select the column heading Last Name. Apply underline and highlight color yellow. Apply the same format to the column headings First Name and E-Mail.
- Scroll through the email column of the report. For any E-Mail that is missing, type in the email using the convention lastnamefirstnane@spscc.edu. There should be two records that are missing an E-Mail address. Apply the font color red to the email addresses just added.
- At the bottom of the report, delete the comment that starts with “If a faculty email is missing…”
- Close your browser window to exit out of Google Docs.
- Submit or share your Google doc per your instructor’s instructions for grading.
MASTER ACTIVITY 2
Complete the following Master Activity and submit your completed project.
In this assignment, you are working as a database administrator (DBA) for a healthcare company. Your supervisor has asked you to apply fixes to this database so that it will function as expected. Fixes to the database include:
-
- Correct the patient import from Excel so that it will accurately update patient data.
- Create a user-friendly patient intake form based on the patient table to streamline data entry.
- Correct the Copay Query so that only those patients that are missing a copay are listed.
- Create a query that only lists patients in the city of Phoenix.
- Create a query that only lists patients in the ED and CCU.
- From your data files, open the file Starter_Access_Master_2. On backstage view, under File, Save As, save the database as Lastname_Firstname_Access_Master2 in your assignment files folder.
- Open the Patient Table in Design View. Notice the primary key field, and other fields and their properties. Close the table without making any changes. Import the Excel file Import_Access_Master_2 into the existing Patient table. If the import fails, re-open the Patient table in design view, make corrections to the field name, and re-run the import. Once the import runs successfully, there should be 21 records on the Patient table.
- Create a form based off of the Patient table. The form should:
- Include all fields from the Patient table
- Include a theme and colors
- Include an image in the form header
- Have a user-friendly format
- Be titled Patient Intake Form
- Be sure to test out the form by adding a new record to the table and make any modifications as needed.
- Open the Copay query in design view, and add criteria so that only those patients that are missing a copay (copay is 0) are shown in the query results.
- Create a query, with all fields from the Patient table, that displays patients from the city of Phoenix only. Name the query Phoenix.
- Create a query, with all fields from the Patient table, that displays patients with a Unit of CCU or ED. Name the query ED or CCU.
- Close all database objects, close the database, and submit per your instructor’s instructions.
MASTER ACTIVITY 3
Complete the following Master Activity and submit your completed project.
In this activity, you will create a course sequencing database in Access for your anticipated plan of study. Your database should include:
- A table with the following fields:
- Course Code (ex: OFTEC 108)
- Course Description (ex: Introduction to Microsoft Office)
- Semester (this will indicate the past or present semester that you plan to take or have completed the course).
- Letter Grade (if completed)
- A form to enter the data above
- A query that identifies missing Letter Grades
- A query that identifies the upcoming semester’s courses
- A report that identifies the upcoming semester’s courses (can be built from the query)
The following should also be included:
-
- A theme for the Form and Report
- A college or program logo for the Form and Report
- The Report must have a page number and current data and time
- Ensure the report prints neatly to one page
CHALLENGE IT

Complete the following Challenge and submit your completed project.

In this challenge activity, you will complete a project that incorporates many of the key skills learned in this unit. For this project, you are a Database Administrator responsible for managing data on student athletes at South Puget Sound Community College.
You will create an Access database from scratch that includes:
- Tables
- Students
- Sports
- Queries
- Student Athlete Scholarships: Which student athletes have a scholarship?
- Summer Soccer Training: Which student athletes are on the soccer team and are required to train over the summer?
- Student Athletes in Health Sciences: What student athletes are in the Health Sciences field of interest?
- Baseball or Softball Student Athletes: What is the field of interest for baseball or softball student athletes?
- Forms
- Sports
- Students
- Reports
- Student Listing
- Open Access and select Blank Desktop Database. Save the database in your data files folder, and name it Lastname_Firstname_Access_Challenge, and create the database.
- Create a new table titled Students, with the following fields and data types. Save and close the table when completed.
|
StudentID |
Short Text |
|
First Name |
Short Text |
|
Last Name |
Short Text |
|
Field of Interest |
Short Text |
|
Sport |
Short Text |
|
GPA |
Number |
|
Anticipated Graduation Year |
Short Text |
|
Scholarship |
Yes/No |
- Import the Excel spreadsheet data titled Access_Challenge_Import1 and append it to the Students table. Fifty-two records should import into the Students table. Ensure the Student ID is the primary key and close the Students table. Be sure to resolve any import errors before continuing.
- Import the Excel spreadsheet data titled Access_Challenge_Import2 into a new table in the current database. Ensure the first row containing column headings is checked, keep the default field imports, and assign Sport as the Primary Key. Name the new table Sports. Open the Sports table to verify there are 6 records.
- Create a relationship using the Sports and Students tables using the Sport field to join the two tables. Enforce referential integrity and select both cascade options. Save and Close the relationships window, resolving any error or warning messages.
- Create a new query using Query Design that answers the question: Which student athletes have a scholarship? Include all fields from the Students table, include criteria to indicate those students that have a scholarship, and sort the query ascending by Last Name. Do not display the StudentID or GPA fields in the query. Run the query to verify there are 20 records. Save the query as Student Athlete Scholarships. Close the query.
- Create a new query using Query Design that answers the question: Which students are on the soccer team and are required to train over the summer? Include the following fields from the Students table: First Name, Last Name, Sport. Include the Summer Training field from the Sports table. Include criteria to indicate those students that have the correct sport (soccer) and summer training (yes). Sort the query ascending by the Last name field. Run the query to verify there are 12 records. Save the query as Summer Soccer Training, and close it.
- Create a new simple query using the Query Wizard that answers the question: What student athletes are in the Health Sciences field of interest? Include all fields from the Students table, detail format, name the query Student Athletes in Health Sciences, and modify the query design. Add criteria to only include those students with a field of interest in Health Sciences. Run the query to verify there are 31 records. Save and close the query.
- Create a new simple query using the Query Wizard that answers the question: What is the field of interest for baseball or softball student athletes? Include the following fields from the Students table: First Name, Last Name, Field of Interest, and Sport. Name the query Baseball or Softball Student Athletes and modify the query design. Add criteria to the Sport field to include softball or baseball only. Run the query to verify there are 14 records. Save and close the query.
- Using the Form Wizard, create a form based off of the Sports table. Include all of the Fields from the Sports table, tabular format, and name the form Sports. Open the form to view or enter information. Add a new record to the form with the following information:
- Sport: Cross Country
- Summer Training: No
- GPA Requirement: 3
- In Design view, change the Summer Training label and textbox so that it is about 2″. Resize the GPA Requirement label and control so that you can see the entire label. Apply the organic theme with Blue colors, and Arial font. Save and close the form.
- Using the Form Tool, create a Form based off of the Students table. Apply the organic theme with Blue colors, and Arial font. In Design View, change the title in the form header to Student Athletes, and add the Puma image from Access Practice 4. Resize the image and form header if necessary to ensure both the title and image display. Save the Students Form and close the form.
- Create a report using the report wizard and the Students table. Include the following fields: First Name, Last Name, Field of Interest, Sport, and Scholarship. Add a grouping level based on Field of Interest. Sort ascending by last name, then first name. Apply the Stepped layout, portrait orientation, and adjust the field width so all fields fit on a page. Title the report Student Listing and preview the report. In Design view, apply organic theme with Blue colors, and Arial font. Insert the same image of the Puma from Practice 4 into the Report Header. Resize the image and header if necessary to ensure both the title and image display. Save and close the report.
- Save and close all database objects, and take note of where your database is stored. Close out of Access and submit your entire database per your instructor’s instructions.
