Chapter 1: Introduction to Geography
Chapter 1: Introduction to Geography
David Dorrell and Joseph P. Henderson
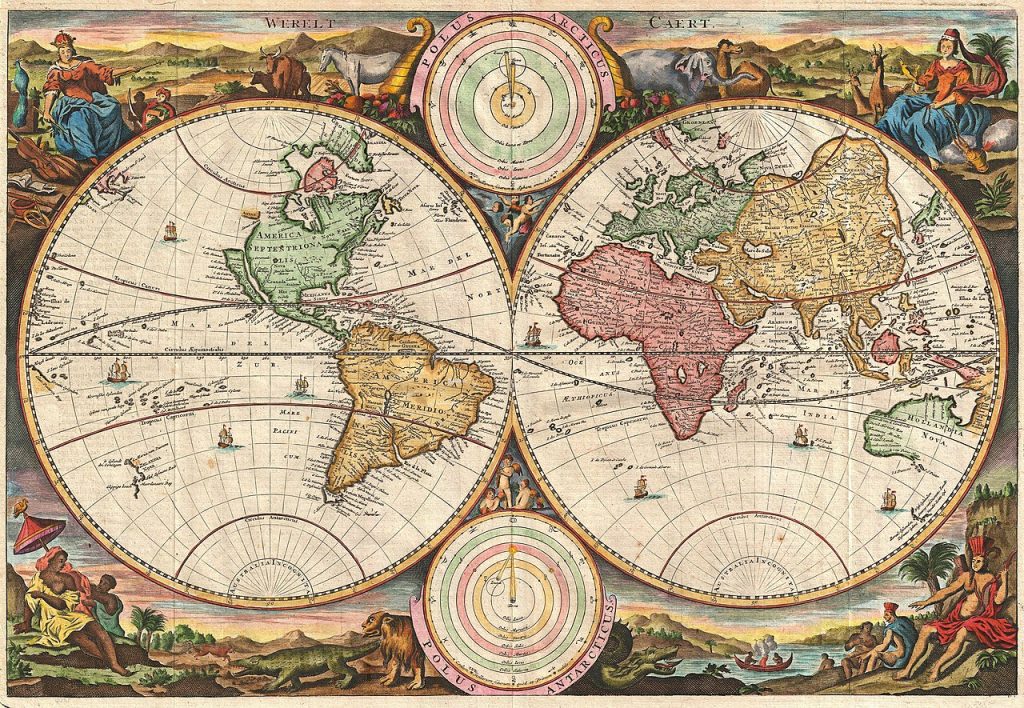 1730 Map of the World by Stoopendahl. Author | Daniel Stoopendahl; Source | Wikimedia Commons; License | Public Domain.
STUDENT LEARNING OUTCOMES
By the end of this section, the student will be able to:
Define: geography and its subfields
Understand: the importance of maps and some tools used to create them
Explain: the concept of places and how they are characterized from a spatial perspective
Describe: the various types of diffusion
Connect: the discipline of geography with other academic disciplines
CHAPTER OUTLINE
1.1 Introduction
1.2 What is Geography?
1.3 Mapping the World
1.4 Where in the World am I?
1.5 How do I Describe Where I am?
1.6 Geographic Data Gathering and Analysis
1.7 Changes in Places: Diffusion
1.8 The Human-Environment Relationship
1.9 Key Terms Defined
1.10 Works Consulted and Further Reading
1.11 Endnotes
1.1 INTRODUCTION
Geography is a diverse discipline that has some sort of connection to almost every other academic discipline. This connection is the spatial perspective, which essentially means if a phenomenon can be mapped, it has some kind of relationship to geography. Studying the entire world is a fascinating subject, and geographical knowledge is fundamental to a competent understanding of our world. In this chapter, you will learn what geography is as well as some of the fundamental concepts that underpin the discipline. These fundamental terms and concepts will be interwoven throughout the text, so a sound understanding of these topics is critical as you delve deeper into the chapters that follow. By the end of the chapter, you will begin to think like a geographer.
1.2 WHAT IS GEOGRAPHY?
The term geography comes from the Greek word geographos, which means writing (graphos) about the Earth (geo). Geography is the study of the physical and environmental aspects of the world, from a spatial perspective. Geography has two major subdivisions, human (social science) and physical (natural science). This text focuses primarily on human geography, but because the physical aspects affect humans and vice versa, physical geography will not be completely excluded but will receive less emphasis.
As geographers study the Earth, the one element that binds the discipline of geography and makes it unique is studying the Earth from a spatial perspective. The spatial perspective means that the phenomenon you are studying can be displayed on a map, so geography focuses on places around the world. Geography, then, is a physical (or natural) and social science that asks the fundamental questions, “What is where, and why?” Human geography is a social science that focuses on people, where they live, their ways of life, and their interactions in different places around the world. A simple example of a geographic study in human geography would be where the Hispanic population is concentrated in the U.S., and why? A physical geography research endeavor might ask, Where do most hurricanes strike the U.S. coastline, and why? In addition, because the Earth is dynamic, geographers also look at how places change through time, and why, so there is a natural connection with history.
1.2.1 Geography and Its Relationship to Other Disciplines
Not only is there a connection between geography and history, but geography is also related to a broad range of other academic disciplines (Figure 1.1). If you examine Figure 1.1, you may find your own major on the outside margin of the circle, with the corresponding subdiscipline in geography on the interior of the circle. Again, if a phenomenon can be depicted on a map and studied from a spatial perspective, it is geographical. A basic example would relate to the health sciences or medical geography, the subfield of geography that focuses on the spatial patterns of various aspects of health. For example, when the spread of a disease from its source area is mapped, medical professionals can get a better idea of the causes of the disease and the mechanisms of its transmission. Often, the understanding of cultural practices or environmental conditions (such as the habitat for a mosquito-borne disease) can shed light on the process of how the disease operates. Another example of how geography relates to other disciplines is in economic geography, the subfield that examines the different economic activities in various places, and how places interact economically. A fundamental concept in economic studies is that the location of a business is often important to the success of that business. If the business is located in close proximity to its clientele, for example, the customers might be more likely to visit that restaurant, store, etc. on a regular basis. A business owner would be wise to consult maps of both transportation networks as well as the population of the customers to which they intend to cater. Data with geospatial content is prevalent worldwide, and the federal government estimates that 80% of all data in the world contains some type of locational information (GAO 2015).
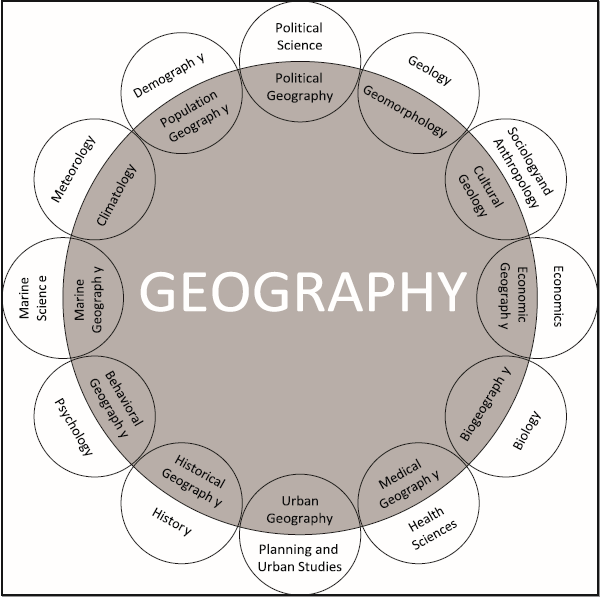 Figure 1.1 | Geography Relationships, Author | Corey Parson, Source | Original Work, License | CC BY-NC-SA 4.0
H5P Activity: Flashcard
1.3 MAPPING THE WORLD
Cartography is the science and art of making maps, which is fundamental to the discipline of geography and has been used by humans since before 6,000 B.C. Today’s maps are much more sophisticated, complex, and precise and are used by many people who employ GPS mapping systems in their vehicles. This technology allows motorists to navigate from place to place with relative ease, but the process by which these digital and other maps are created is exceptionally complex.
Essentially, a map, which is a flat presentation of a place on Earth, is actually depicting a curved surface. The Earth, which looks like a sphere, is technically an oblate spheroid, which means that the “middle” of the Earth, around the equator, is slightly wider, and the north/south pole axis is slightly shorter than a perfect sphere. When any curved surface is depicted on a flat surface, that process is known as projection. The three major types of projections are conic, cylindrical, and planer. Each projection has some sort of error/distortion, and deciding on which one to use is based on what is being mapped. The size, shape, distance, and direction of objects are distorted to various degrees on maps. The reason this distortion occurs can be visualized by simply imagining peeling an orange and trying to flatten the peel on a table. If you drew the continents on that orange before peeling it, the continents would most certainly be distorted when you try to flatten the peel on the table. This analogy does not precisely describe how projections are created; the process is much more involved. However, the underlying principle still applies. An example of distortion is shown on the map of the globe below (Figure 1.2). Note, for example, in this Mercator projection that Greenland appears to be larger than South America, although it is, in fact, much smaller. A fun presentation of mapping issues can be seen in Video 1.
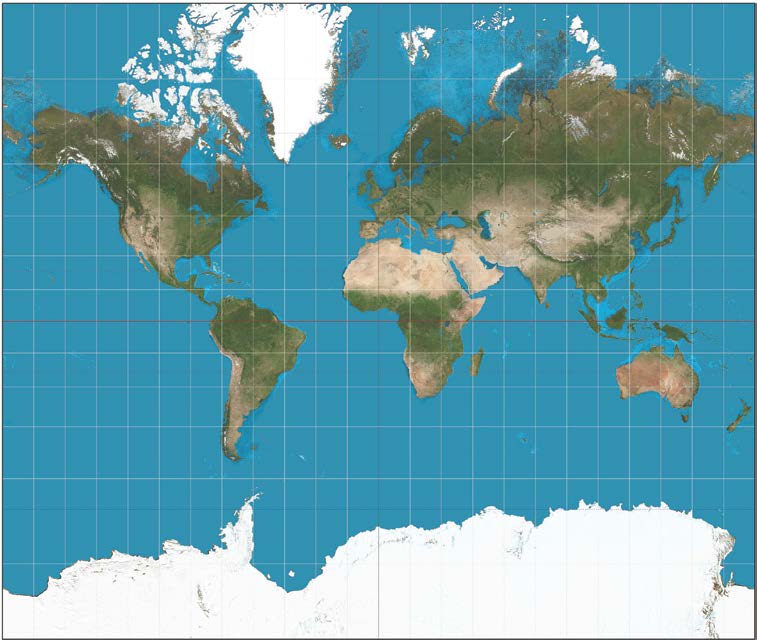
Figure 1.2 | World Map, Author | User “Strebe,” Source | Wikimedia Commons, License | CC BY-SA 4.0
Video 1. Why All World Maps are Wrong; Author | Vox Source | YouTube License | https://www.youtube.com/watch?v=kIID5FDi2JQ&ab_channel=Vox
Besides projections, another important characteristic of maps is the scale. The scale of a map is a ratio of the length or distance on the map versus the length or distance on the Earth or ground (actual). The amount of detail shown on a map will vary based on the scale. For example, a map with a scale of 1:100,000 (which means 1 in/cm on the map equals 1,000,000 in/cm on the ground) would show much less detail than a map at a scale of 1:10,000 (Figure 1.3). Besides showing scale as a ratio, it can also be presented as a bar graph or as a verbal statement. Scale can also mean the spatial extent of some kind of phenomenon. For example, one could examine migration at the global, national, state, or local scale. By either definition, however, each refers to the level of detail about the place that the geographer is researching. Examining the world from different scales enables different patterns and connections to emerge.
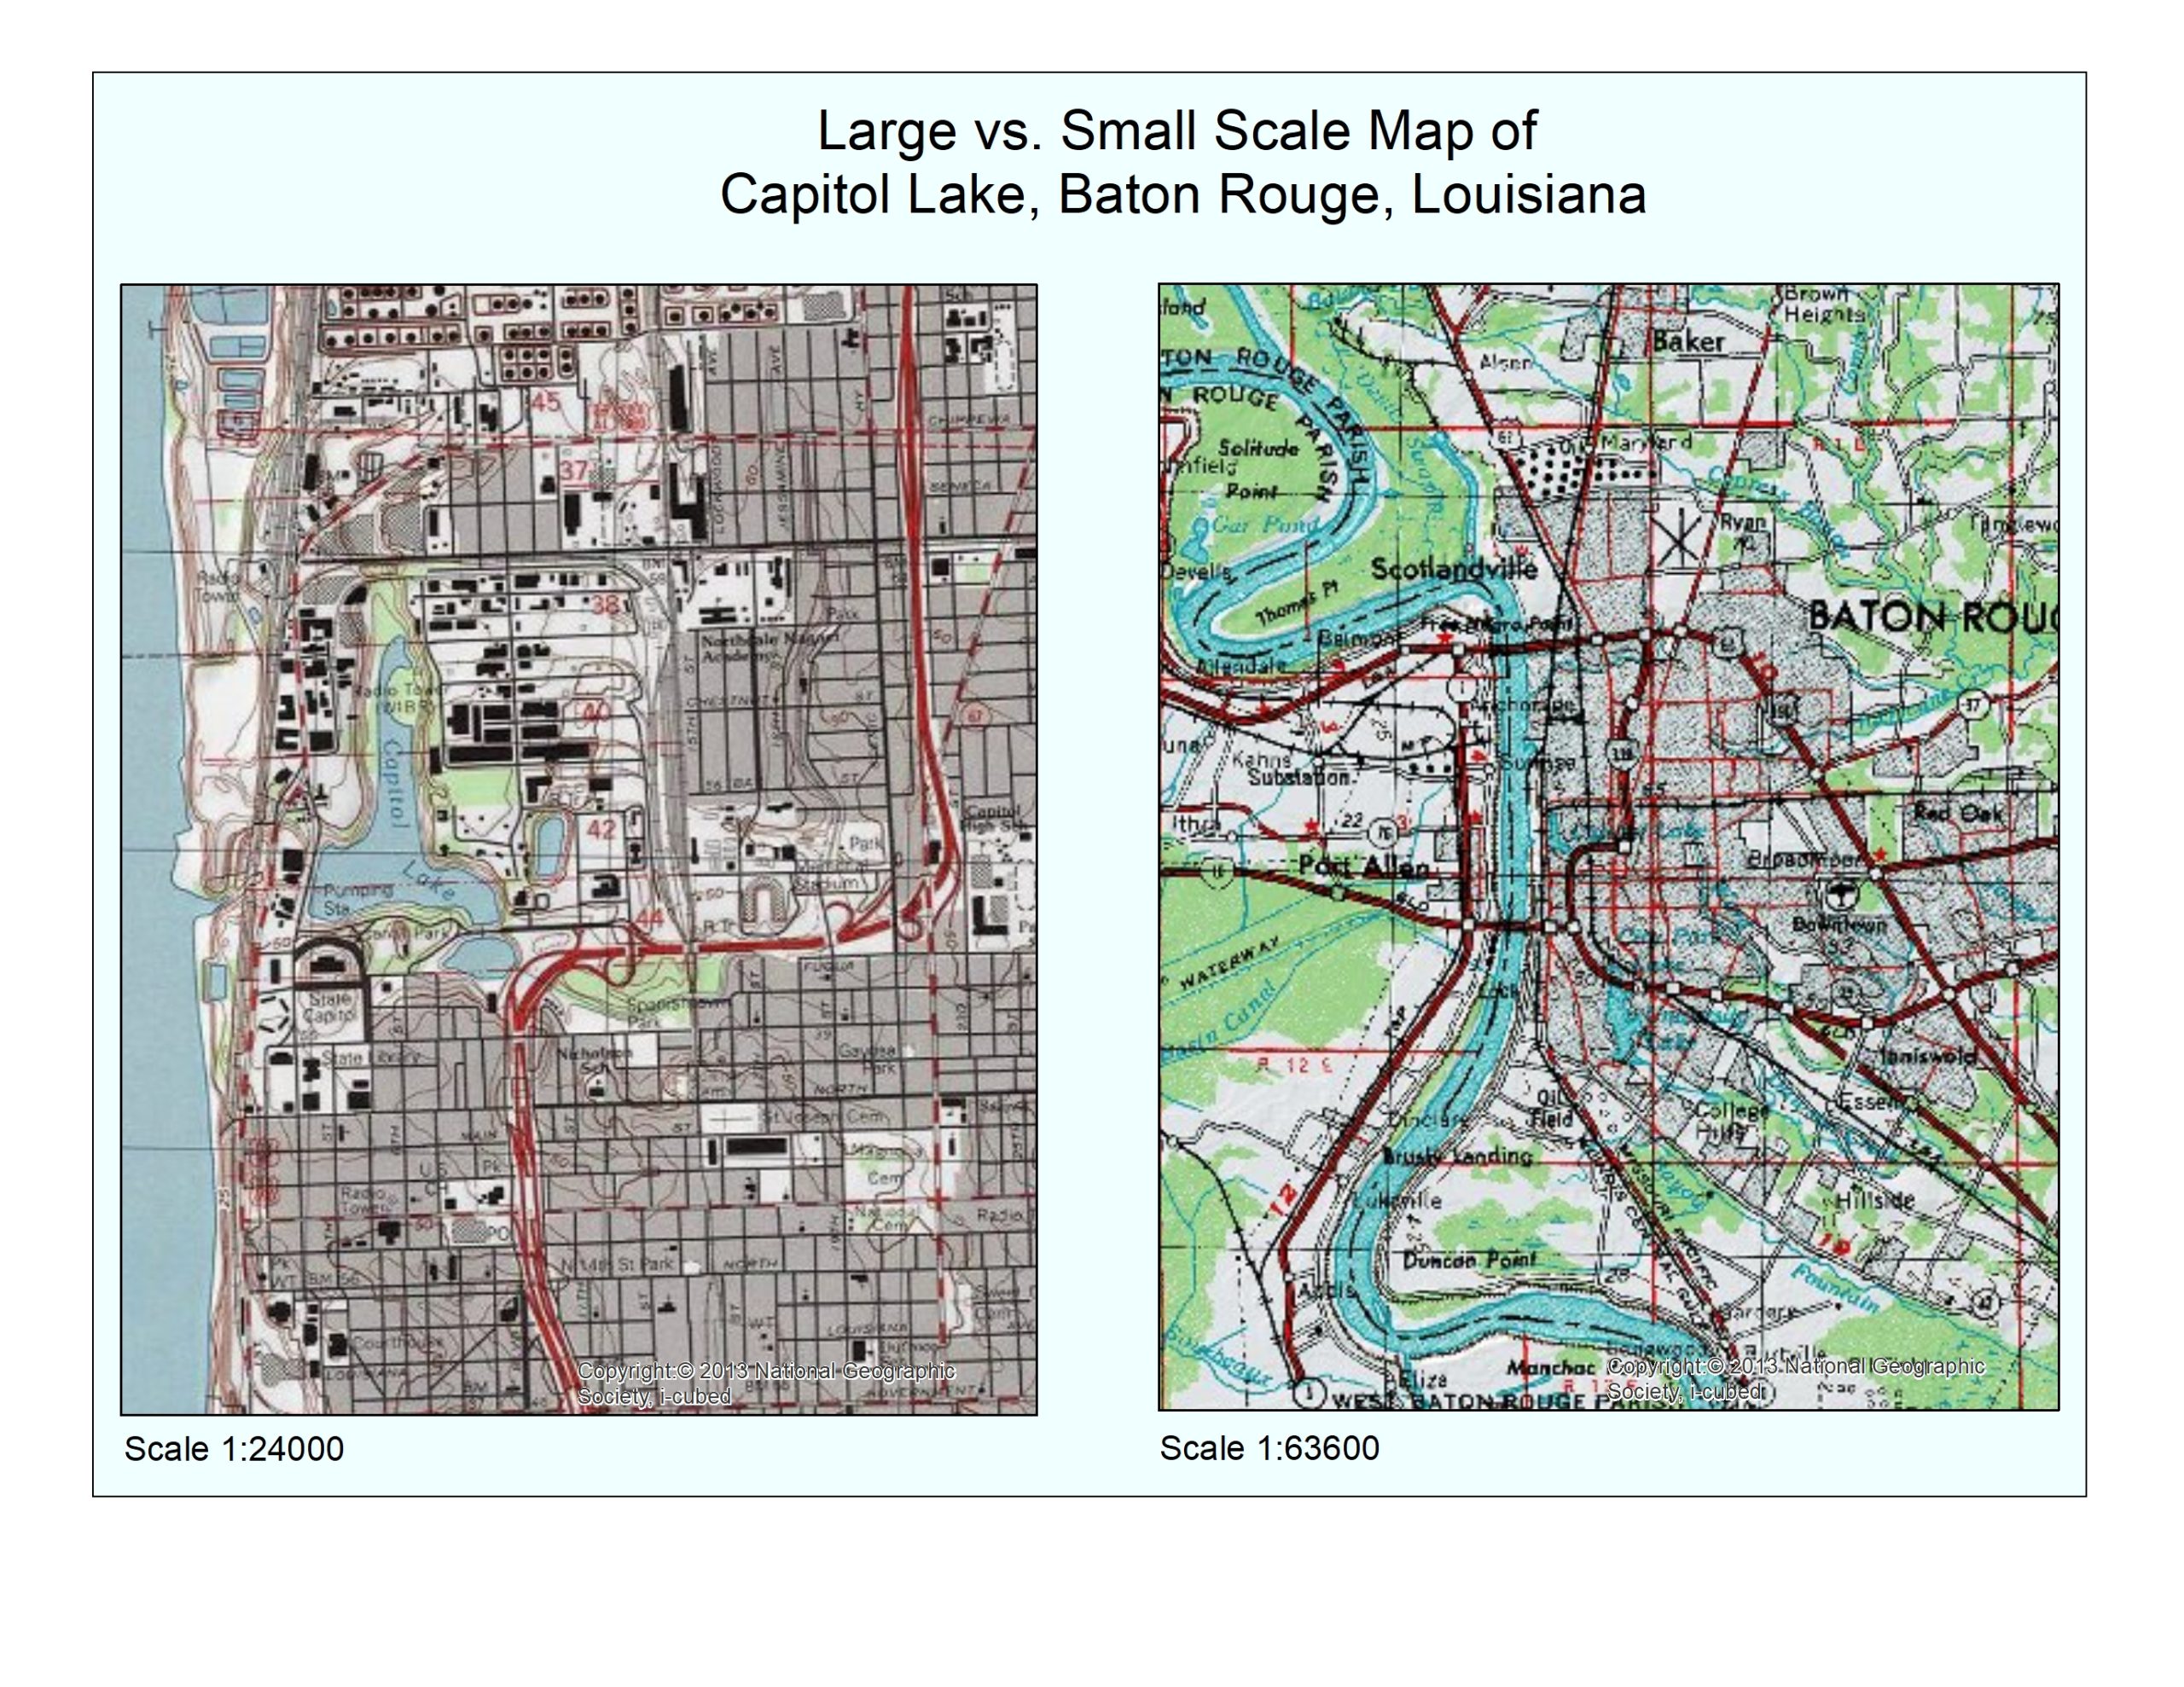 Figure 1.3 Comparison of Map Scales, Author | Molly McGraw, USGS Maps, Source | USGS US Topographic Maps, License | CC BY-NC-SA 4.0. The map on the left is a small-scale map, showing a larger area. The map on the right is a large-scale map, showing a smaller area.
H5P Activity: Crossword
1.4 WHERE IN THE WORLD AM I?
One of the most important pieces of information that maps provide is location. Knowing precisely where a place is in the world is fundamental to geography.
While one can define a location simply by using a street address, not all places on Earth have such an address. Therefore, one of the basic ways to pinpoint a location on the Earth is using the geographic grid. The geographic grid is comprised of meridians and parallels, which are imaginary lines and arcs crisscrossing the Earth’s surface. Meridians are half circles that connect the north and south poles, and longitude refers to the numbering system for meridians. Parallels are circles that encompass the Earth and are parallel to the equator, and the numbering system for these circles is known as latitude (Figure 1.4, Video 2). Degrees of longitude extend from the north to the south pole and measure the angular distance from east to west. Meridians originate at the Prime Meridian (0 degrees longitude), which is in Greenwich, England, and extend eastward and westward until they meet at 180 degrees, which is in the middle of the Pacific Ocean.
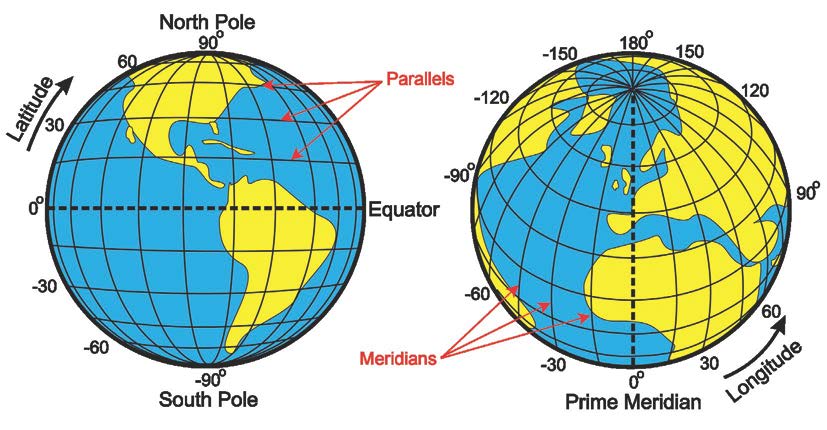
Figure 1.4 Longitude and Latitude; Author | User “Djexplo” and Corey Parson; Source | Wikimedia Commons; License | 4.0. The geographic grid comprised of meridians and parallels with longitude and latitude.
Video 2 Latitude and Longitude; Author | Andy Jensen Source | YouTube License | https://www.youtube.com/watch?v=swKBi6hHHMA&ab_channel=AndyJensen
Degrees of latitude originate at the equator (0 degrees latitude) and extend northward and southward to the poles (90 degrees). Lines of latitude never touch and are always parallel to each other. Where meridians and parallels intersect at precise locations (points) on the Earth on the geographic grid, a location can be known by its latitude and longitude.
A few meridians on Earth are of particular importance, one being the Prime Meridian located at 0° longitude, which passes through Greenwich, England. The other important meridian, called the International Date Line, follows roughly along 180° longitude, and this meridian is on the opposite side of the world from the Prime Meridian (Figure 1.5). When a traveler crosses the International Date Line, the day of the week instantaneously changes. When moving westward, the day moves forward, and when traveling eastward, the date jumps backward one day. Fortunately, the International Date Line is in the middle of the Pacific Ocean, so disruptions to the daily calendar are minimal for most people in the world. Moreover, the International Date Line does not precisely follow the 180° longitude line, and this accommodation allows countries and territories consisting of islands that straddle 180° longitude to share the same calendar date.
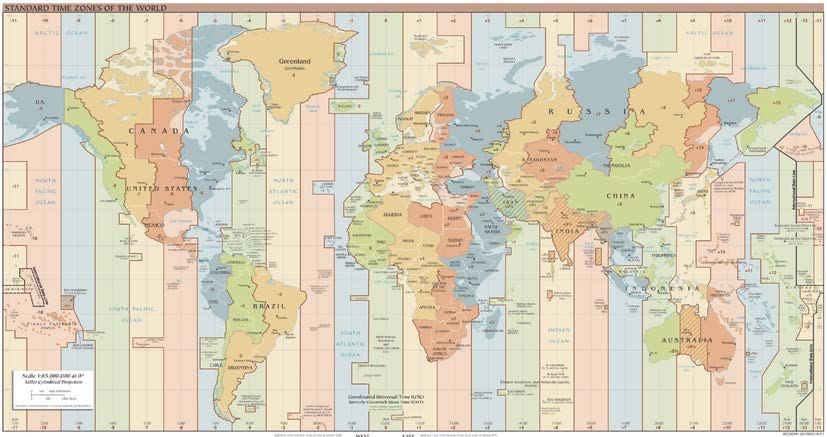
This world map shows the international date line and global time zones.
Figure 1.5 Times Zones; Author | Central Intelligence Agency; Source | Wikimedia Commons; License | Public Domain
H5P Activity: Chart
1.5 HOW DO I DESCRIBE WHERE I AM?
Defining a location by using the geographic grid is only part of the process of describing a place. Geographers are primarily concerned with two ways of describing a place: site and situation. Site refers to the physical characteristics, such as the topography, vegetative cover, climatic conditions, and the like. The situation, on the other hand, refers to the area surrounding the place and is sometimes referred to as relative location. In other words, where is this place relative to other places, and how is it connected to its surroundings via transportation networks? New Orleans provides an excellent example of a site versus situation. The site of New Orleans is not ideal for a city, as it lies below sea level and is prone to flooding. However, the situation of New Orleans is much better in that New Orleans is connected to a large portion of the Mississippi River’s network of navigable waterways while also being close to the Gulf of Mexico and convenient to coastal traffic. Hence, the situation of New Orleans is why the city has not long since been abandoned, despite catastrophic flooding such as during Hurricane Katrina in 2005. As we examine various places around the world, both site and situation are key considerations in determining the “why” of where a place is located.
1.5.1 Regions
While site and situation can help describe a place, a broader view of the world and the connections between places can be derived from the concept of regions. A region is an area that shares some sort of common characteristic that binds the area as a whole. Geographers use regions to help one understand the interconnections between places and simplify a complex world. Two major types of regions are formal and functional. Formal regions are characterized by homogeneity or uniformity in one or several different characteristics. These characteristics can be both human and physical-related, so regions could be defined by climate or vegetation types, in the sense of physical geography, or they could be defined by language or ethnicity, in the sense of human geography. One example of a map that includes formal regions would be a map of the states in the US or a map showing the counties or parishes of a state. In this map, the parishes of the State of Louisiana could be considered a formal region because each state is governed commonly or uniquely and hence portrays homogeneity (Figure 1.6).
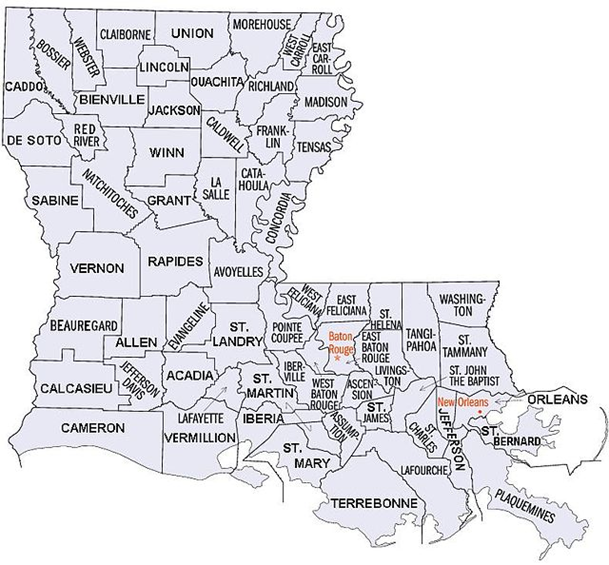
Figure 1.6 Map of Louisiana’s Parishes, Author | Wikipedia, Source | Wikimedia Commons, License | Public Domain
A functional region, which is sometimes called a nodal region, is an area that contains a central node or focal point to which other places in the region are connected by some activity. Functional regions can be seen in cities where the central area of the city might serve as the focal point for the rest of the metropolitan area (Figure 1.7). At a smaller scale, a Wi-Fi hotspot could be considered the focal point of a functional region that extends to the range of the Wi-Fi signal. Even the delivery area for the local pizza restaurant would be a functional region with the restaurant as a central node.
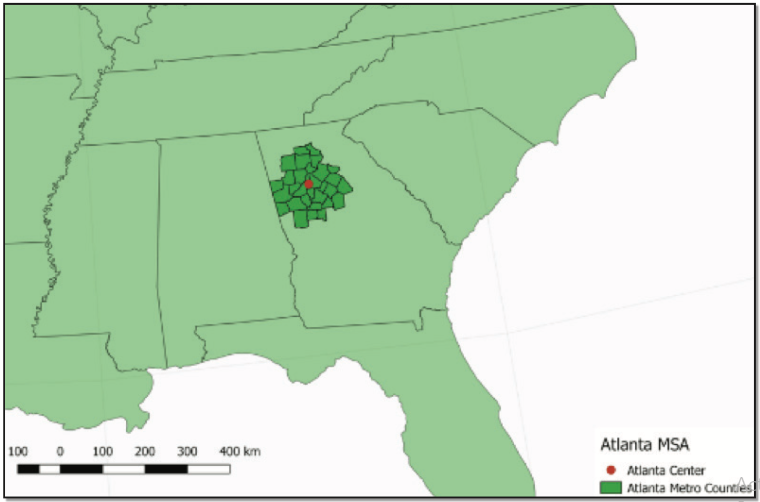
Figure 1.7 Atlanta MSA; Author | David Dorrell; Source | Original Work; License | CC by SA 4.0. Atlanta Metropolitan Statistical Area (MSA) as defined by the US Census Bureau.
Regions are devised and not absolute, so whether or not a particular place fits within a region is sometimes a matter of dispute. For example, scholars disagree on the exact extent of the American South as a formal region. What defines this region?
It depends on what characteristics one uses to define the region, be they food, dialect, political affiliation, historical affiliation in the Civil War, or any other element the mind conjures up when one thinks of the South as a relatively homogeneous formal region. Most geographers see Texas as a part of the South, but West Texas is much different from East Texas, and Florida is likewise diverse. Extreme southern Florida is vastly different from the panhandle of Florida in ethnic make-up and political affiliation. The opinion on what constitutes the Southern region varies based on personal viewpoints (Figure 1.8). The Southern region, then, may be thought of as a vernacular (or perceptual) region because the boundaries of these types of regions depend on the perspectives or mental maps of different groups of people who live both outside or inside that region. Hence, the concept of regions and their definition is not a straightforward process and involves generalities and varying opinions.
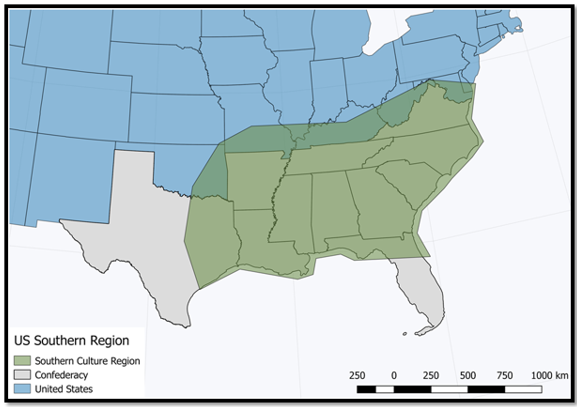
Figure 1.8 | The Fuzzy Boundaries of the American South, Author | David Dorrell, Source | Original Work, License | CC BY SA 4.0. It is not exactly the old Confederacy or the slave states. And it varies from one part to the next.
1.6 GEOGRAPHIC DATA COLLECTION AND ANALYSIS
To analyze and develop regions, describe places, and conduct detailed geographic analysis, two important tools have been developed that are of particular value to geographers. The first is remote sensing, or the acquisition of data about the Earth’s surface from aerial platforms such as satellites, airplanes, or drones. Images taken from these airborne machines can provide a wealth of valuable information about both the human and physical characteristics of a place. For example, satellite imagery can depict the extent of human impact on rainforests in the Amazonian rainforest of Brazil (Figure 1.9). Imagery can also depict information that humans cannot see with the naked eye, such as the temperature of the Earth’s surface. One example is a thermal infrared image, which can show warm temperatures in red tones and cooler temperatures in blue tones (Figure 1.10). Drones are used more and more frequently immediately following natural disasters like flooding and hurricanes since showing a before and after snapshot of damages can be critical to disaster recovery.
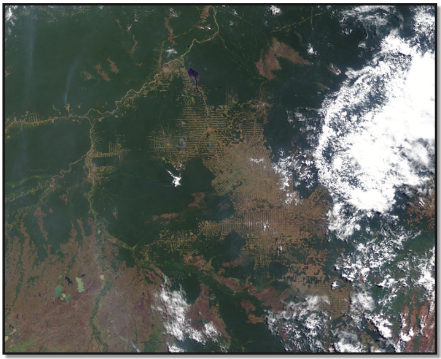
Figure 1.9 | Deforestation; Author | NASA; Source | Earth Observatory; License | Public Domain. Deforestation in the state of Rondônia, western Brazil.
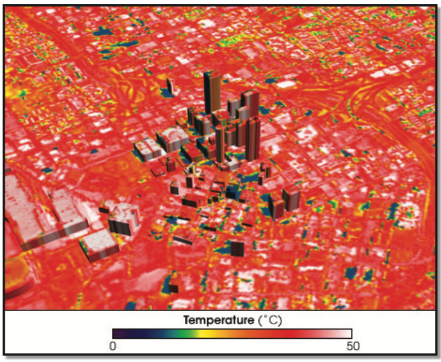
Figure 1.10 Thermal Imaging; Author | NASA; Source | Wikimedia Commons; License | Public Domain; Thermal imagery of Atlanta, GA.
Digital imagery like the one in Figure 1.9 is in a format that can be entered into Geographic Information Systems (GIS), the second important tool employed by geographers. GIS combines computer hardware and software in a system that stores, analyzes, and displays geographic data with a “computer mapping” capability. Geographic data is stored in layers, and these layers of data can be queried in several sophisticated ways to analyze some aspect of an area (Figure 1.11, Videos 3, 4, and 5). Each data point in a GIS is georeferenced to a precise location on the Earth’s surface (latitude and longitude, for example), and these data points have different attributes corresponding to the data layer they are associated with. Data layers can represent a myriad of characteristics about that data point, such as elevation, soils, the presence of water, per-capita income, ethnicity, etc. Overlaying the data layers can provide incredible insights into the connections between characteristics/factors in places, such as the connection between per-capita income and ethnicity or the links between soil types and vegetative cover. GIS also has a vast suite of other capabilities such as least-cost paths for transportation, line-of-sight perspectives from a particular location, or 3-D models of urban areas. Because of their multi-faceted capacity to present geographic information, businesses and government agencies around the world use GIS to answer questions, plan development, chart delivery routes, and even monitor crime and first responder activity (Figure 1.12). It is not surprising that one of the fastest-growing job markets is in GIS technology, as GIS jobs exist at the local, state, and national levels as well as in many businesses in the private sector. Even the U.S. Census Bureau maintains an extensive GIS database known as Topologically Integrated Geographic Encoding and Referencing (TIGER). Another growing community that is very popular in GIS is OpenSource mapping and software. The QGIS movement was founded in 2002 by Gary Sherman. The idea was to provide free mapping software and data to the geospatial community and to ensure high-quality methodologies and practices. (https://www.qgis.org/en/site/)
Video 3. How to Download & Install QGIS 3.28.0
Video 4 Step-by-Step Guide for Beginners 2022.
Video 5 QGIS Absolute Beginner’s Guide
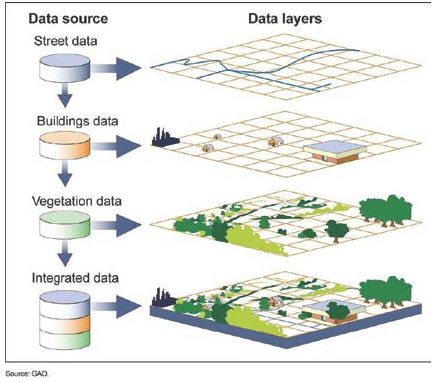
Figure 1.11 Data layers in a Geographic Information System (GIS); Author | US Government Accountability Office; Source | National Geographic; License | Public Domain.
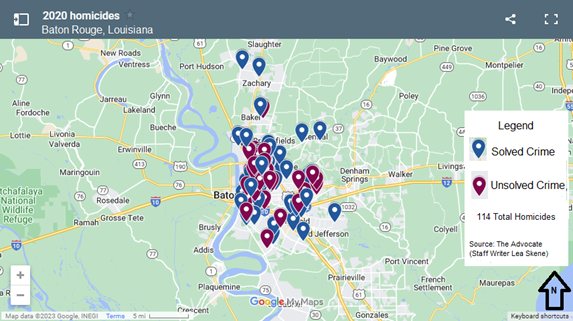
Figure 1.12 Crime Analysis; Author | Lea Skene; Source | The Advocate; License | CC BY SA 2.5. Crime analysis of Baton Rouge, Louisiana
1.7 CHANGES IN PLACES: DIFFUSION
Thus far, we have examined the Earth in a rather static fashion by learning about places and regions, how maps are created, and how geographic information is gathered and analyzed. However, the Earth is dynamic and constantly changing, and one of the reasons places change is because of diffusion. Diffusion is the spread of ideas, objects, inventions, and other practices from place to place. As people migrate or move to a new area, they bring their ideas, objects, and the like with them in a process called relocation diffusion. Another diffusion process involves the spread outward from a core area that contains the idea, cultural practice, etc. This type of diffusion is expansion diffusion, and this type of diffusion can occur from person-to-person contact (as with a contagious disease) or through a hierarchy, or stratified condition, where the idea might originate in a major city, spread to medium-sized cities, and so on to smaller cities (Figure 1.13).
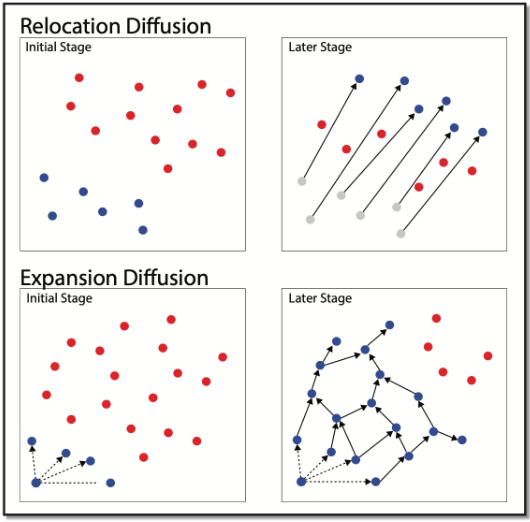
Figure 1.13 Diffusion; Author | Corey Parson; Source | Original Work; License | CC BY SA 4.0.
H5P Activity: True False
1.8 THE HUMAN-ENVIRONMENT RELATIONSHIP
The process of spatial diffusion can be profoundly affected by the physical terrain, such as in the case of a mountain range. Because migration and transportation over mountain ranges can be limited, diffusion can be slowed or even stopped by these physical barriers. This example is but one instance of the relationship between humans and their environment. The environment can significantly affect human activities, and vice versa, humans can shape and change the Earth’s surface and its atmosphere. Two major perspectives on the human-environment relationship in the field of geography are environmental determinism, which has been largely rejected, and possibilism. Environmental determinism is the idea that the natural or physical environment shapes and creates cultures; in other words, the environment essentially dictates culture. For example, environmental determinists in the 1920s thought that people who lived in the tropics were slothful and backward because finding food in the tropics was thought to be rather easy. In contrast, Europeans, who lived in “stimulating” climates with a sharp change in seasons, were more industrious and inventive. The racist undertones of this sort of perspective are clear, but modern geographers still recognize the definitive impact of the environment on societies, as can be seen, for example, in the theorized demise of the Anasazi people in the American Southwest because of extended drought (Figure 1.14).
The Anasazi, who are believed to have inhabited the Southwestern U.S. from 100 B.C. to 1300 A.D., were ill-equipped to deal with drought, compared to those who inhabit the modern-day states of New Mexico and Arizona. In the view of possibilism, people can adapt to their environmental conditions, despite the limitations they might pose, and if society has better technology, people are better able to adapt and develop their culture in several possible ways.
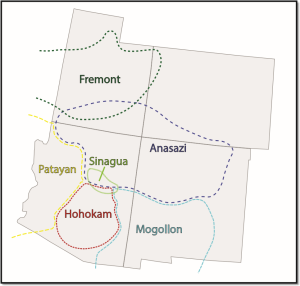
Figure 1.14 | Indigenous People of the Four Corners, Author | Corey Parson, User “Theshibboleth,” Source | Wikimedia Commons, License | CC BY SA 3.0
The possibilities are greater, hence the term possibilism. One excellent example of possibilism is found in Dubai, in the United Arab Emirates. Although snow skiing in the Middle East may seem preposterous, plans are in place to build the longest indoor ski slope in the world in this city, where one ski slope already exists (Figure 1.15). Even technologically advanced societies, however, can still be tremendously affected by the environment and have little or no control over the power of nature. The devastating impacts of hurricanes in Louisiana, tsunamis in Japan, and fire in the United States are but a few examples (Figures 1.16 and 1.17).

Figure 1.15 Ski Dubai; Author | Filipe Fortes; Source | Wikimedia Commons; License | CC BY SA 2.0. Indoor ski slope at Ski Dubai located in the Mall of the Emirates.
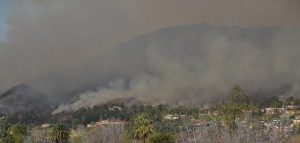
Figure 1.16 Colby Fire, California, 2014; Author | User “Eeekster”; Source | Wikimedia Commons; License | CC BY 3.0. Colby Fire in the San Gabriel Mountains foothills.
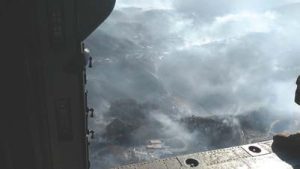
Figure 1.17 Tennessee Wildfires, 2016; Author | Tennessee National Guard; Source | Flickr; License | CC BY 3.0. An aerial shot of the wildfires in Sevier County.
1.9 KEY TERMS DEFINED
Diffusion – the spread of ideas, objects, inventions, and other practices from place to place.
Environmental determinism – the idea that the natural or physical environment shapes and creates cultures; in other words, the environment essentially dictates culture.
Expansion diffusion – this type of diffusion involves the spread outward from a core area that contains the idea, cultural practice, etc. and can occur from person-to-person contact (as with a contagious disease) or through a hierarchy.
Formal region – a region defined by homogeneity in one or several different characteristics.
Functional region – a region that is defined by a central node or focal point to which other places in the region are connected.
Geographic Information Systems – combines computer hardware and software in a system that stores, analyzes, and displays geographic data with a “computer mapping” capability in a system of data layers.
Geography – literally, writing about the Earth; the study of the physical and environmental aspects of the world, from a spatial perspective.
International Date Line – roughly follows 180° longitude.
Latitude – the numbering system for parallels.
Longitude – the numbering system for meridians.
Meridians – half circles that connect the north and south poles.
Parallels – circles that encompass the Earth and are parallel to the equator.
Possibilism – the theory people can adapt to their environmental conditions and choose from many alternatives (possibilities), despite the limitations that the environment poses.
Prime Meridian – 0° longitude, passes through Greenwich, England.
Projection – the process of transferring locations from the Earth’s curved surface to a flat map.
Region – an area that shares some sort of common characteristic that binds the area as a whole.
Relocation diffusion – the diffusion process in which people migrate or move to a new area and bring their ideas, objects, and the like with them.
Remote sensing – acquisition of data about the Earth’s surface from aerial platforms such as satellites, airplanes, or drones.
Scale – the ratio of the length or distance on the map versus the length or distance on the Earth or ground (actual); can also refer to the spatial extent of some phenomenon.
Site – a way to describe a location; refers to the physical characteristics, such as the topography, vegetative cover, climatic conditions, etc.
Situation – a way to describe a location by referring to the area surrounding the place and is sometimes referred to as relative location.
1.10 WORKS CONSULTED AND FURTHER READING
Bjelland, Mark, Daniel R. Montello, Jerome D. Fellmann, Arthur Getis, and Judith Getis. 2013. Human Geography: Landscapes of Human Activities. 12 edition. New York: McGraw-Hill Education.
Boyle, Mark. 2014. Human Geography: A Concise Introduction. 1 edition. Chichester, West Sussex: Malden, MA: Wiley-Blackwell.
deBlij, Harm, and Peter O. Muller. 2010. Geography: Regions, Realms, and Concepts. Fourteenth edition. Hoboken: John Wiley & Sons.
Fouberg, Erin H., Alexander B. Murphy, and Harm J. de Blij. 2015. Human Geography: People, Place, and Culture. 11 edition. Hoboken: Wiley.
Knox, Paul L., and Sallie A. Marston. 2015. Human Geography: Places and Regions in Global Context. 7 edition. Boston: Pearson.
Malinowski, Jon, and David H. Kaplan Professor. 2012. Human Geography. 1 edition. New York: McGraw-Hill Education.
National Aeronautics and Space Administration. “Earth Observatory.” https://earthobservatory.nasa.gov. Accessed August 16, 2018.
National Geographic Society. “Encyclopedia Entries.” https://www. nationalgeographic.org/encyclopedia. Accessed August 16, 2018.
Rubenstein, James M. 2016. The Cultural Landscape: An Introduction to Human Geography. 12 edition. Boston: Pearson.
U.S. Government Accountability Office. 2015. “GEOSPATIAL DATA: Progress Needed on Identifying Expenditures, Building and Utilizing a Data Infrastructure, and Reducing Duplicative Efforts (GAO-15-193).” https://www.gao.gov/products/gao-15-193
1.11 ENDNOTES
- “Western Illinois University.” Liberal Arts Lecture 2011 – University News – Western Illinois University. Accessed April 26, 2018. http://www.wiu.edu/news/lecture_ archive/liberalArts2011.php.
- Fellmann, Jerome D., Arthur Getis, Judith Getis, and Jon C. Malinowski. Human Geography: Landscapes of Human Activities. Boston: McGraw Hill Higher Education, 2005.
- The Anasazi. Accessed April 27, 2018. http://sangres.com/features/anasazi.htm#.
Media Attributions
- 1730_Stoopendaal_Map_of_the_World_in_two_Hemispheres_-_Geographicus_-_WereltCaert-stoopendaal-1730
- scale map © Molly McGraw, Google Maps is licensed under a CC BY-NC-SA (Attribution NonCommercial ShareAlike) license
- Picture4
- Nodes
- US Southern Region
- Deforestation
- Thermal Imaging
- GIS Layers source GAO
- Relocation Diffusion
