Chapter 9: Development and Wealth
Chapter 9: Development and Wealth
Todd Lindley
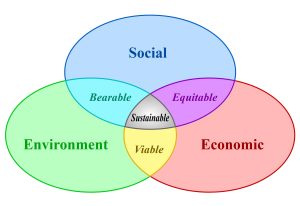
Sustainable Development. Author | Nojhan; Source | Wikipedia Commons; License | CC BY SA-3.0
STUDENT LEARNING OUTCOMES
By the end of this section, the student will be able to:
Understand: the primary measures and terms associated with wealth, poverty, economic growth, and social improvement for gauging levels of development by region and country
Explain: the two paths to development and the attendant strengths and weaknesses of each
Describe: regional differences in economic and social development across the world
Connect: the processes of globalization to development efforts and outcomes that vary dramatically by place
CHAPTER OUTLINE
9.1 Development and Geography
9.2 Core-Periphery Spatial Relationships
9.3 Important Terms & Concepts
9.4 Global, National, Regional, and Local Patterns
9.5 Rostow’s Stages of Growth
9.6 New Models of Development
9.7 Summary
9.8 Key Terms Defined
9.9 Works Consulted and Further Reading
9.10 Endnotes
9.1 DEVELOPMENT AND GEOGRAPHY: AN INTRODUCTION
If you could choose anywhere on the planet, where would you like to live? Would you choose a place with mountains or beaches? A place with high taxes or few regulations? Do you love your community/state/country? Could you make more money somewhere else, or might you be happier with warmer/colder weather? Do you think that you can realize your full personal potential in the place where you live now? Why or why not? Your answers might vary greatly from other people around the world based on what language you speak, your religious preferences, your cultural framework, your experiences, and your values. Nonetheless, there are certain indicators that geographers can use to categorize places according to how developed they are in terms of technology, infrastructure, wealth, and opportunity. As you might guess, the differences between places can be quite stark, but it’s important to understand the dynamics and geography of the patterns and processes associated with income, well-being, and opportunity. This chapter explains how those distinctions are made and how they vary across time and place using the concept of development (the processes related to improving people’s lives through access to resources, technology, education, wealth, opportunity, and choice).
Which places on Earth are the most developed? There is no simple answer to this question. San Francisco is often voted as the most beautiful city in the U.S., but the cost of living makes this place unaffordable for all but the wealthiest of residents. Ancient cities like Jerusalem, Athens, and Baghdad contain amazing architecture and the roots of Western civilization, but streets also tend to be narrow and housing crowded. China has experienced the fastest economic growth of any other country in the past 30 years, but it is accompanied by catastrophic levels of air pollution, poor working conditions, and severe limits on personal liberty. Within the United States, people in Colorado tend to be the healthiest, while those in Utah have the largest houses, and people in Texas are the most loyal to their home state. There are multiple ways to measure development, and geographers spend a great deal of time and effort studying, measuring, and quantifying the differences and commonalities.
A few general truths about development and wealth in our 21st-century world can simplify the complexity:
- The world continues to be divided into the Global North and Global South by the Brandt Line (see Figure 9.1). Levels of wealth, well-being, access to technology, and health tend to be higher in northern countries than in southern ones. The line is problematic because it over-generalizes, but it remains a meaningful starting point for understanding development from a global scale.
- The majority of people living in the 21st century have a higher standard of living, earn more money, are healthier, and live longer than was the case for people 50 years ago.
- Despite #2, the wealth disparity between those at the bottom and those at the top remains greater than ever before. According to Credit Suisse’s global wealth report, the globe’s richest 1% (of people) control more than half of the world’s wealth, up from 42.5% in 2008.
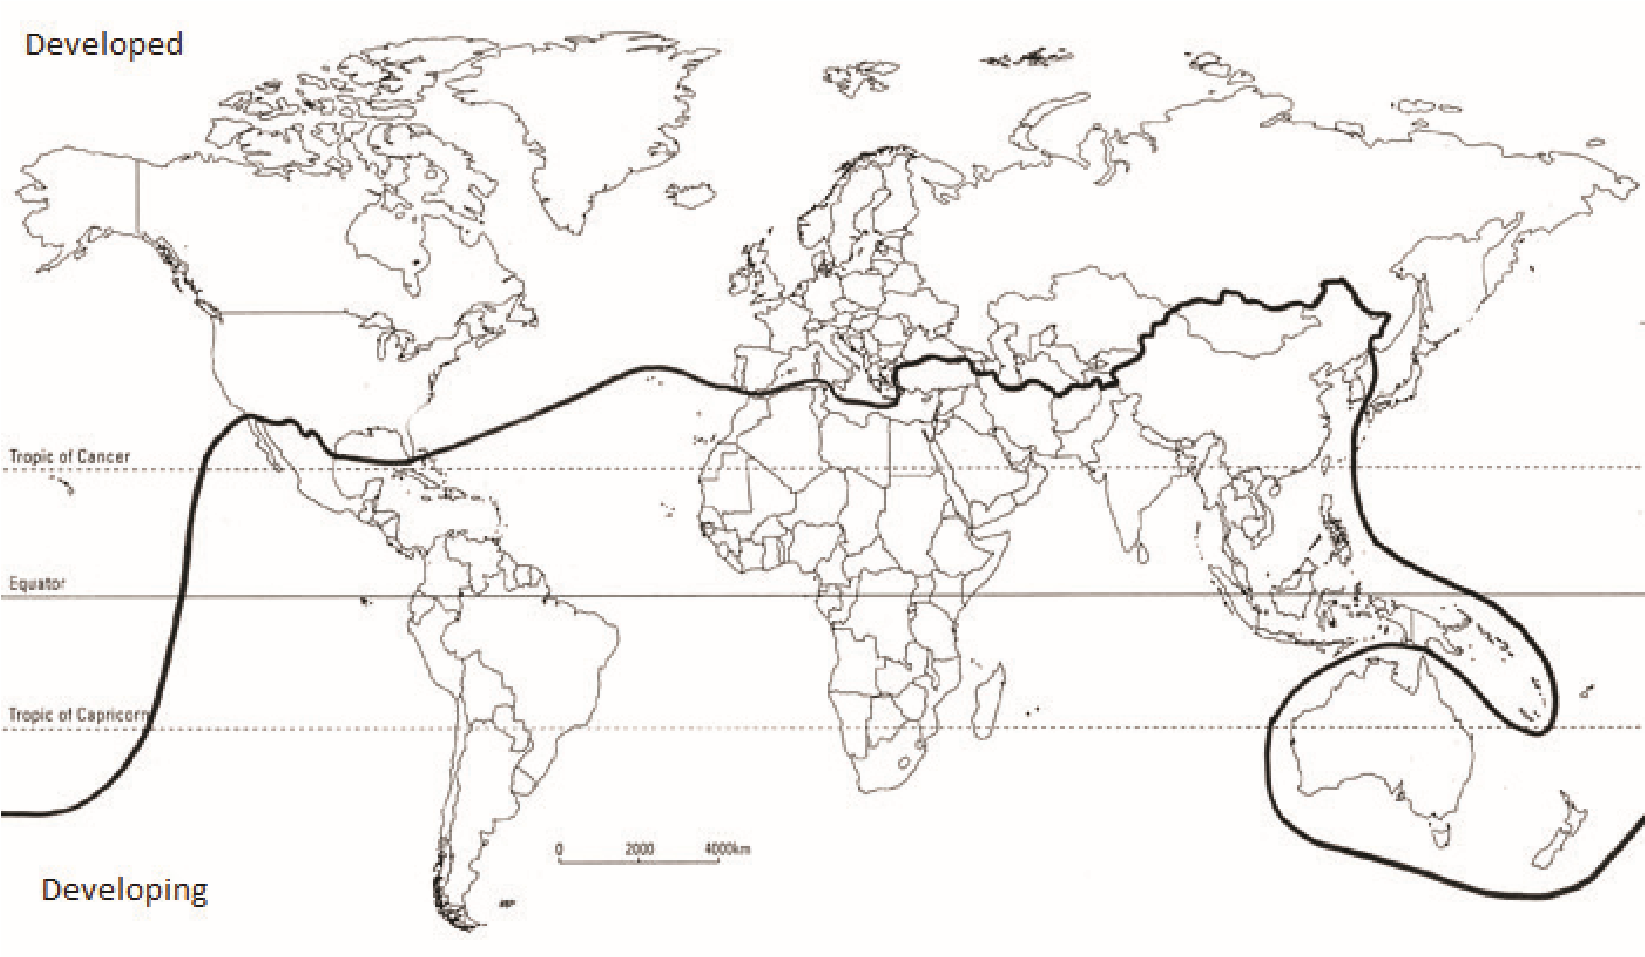
Figure 9.1 The Global North as defined by the Brandt Line in 1980; Author | User “Jovan.gec”; Source | Wikimedia Commons; License | CC BY SA 4.0.
9.2 Core-Periphery Spatial Relationships
One key to understanding development from a geographer’s perspective is thinking about core-periphery spatial relationships at both a local and global scale. On a local scale, there is generally a core area, sometimes known as the central business district, and a hinterland, a German term meaning “the land behind.”
The hinterland is more sparsely populated than the core and is often where goods sold in the core are manufactured. It might include rural farmland, for example. The core, on the other hand, is the commercial focus for the area where most goods and services are exchanged. The hinterland relies on the central city to sell its goods, but similarly, the city relies on the hinterland to produce raw materials. Consider where the hinterland is located around your closest city; the hinterland is characteristically rural, while the core is urban.
The city of Walla Walla in southeastern Washington is an excellent example of this. Walla Walla has a population of about thirty thousand people and is the only significant town in its county. Walla Walla, with a prestigious college, a community college, a state prison, a regional hospital, and retail services, serves as a core hub for the surrounding periphery. The hinterland of Walla Walla has an agricultural economy based on the production of onions, wine grapes, asparagus, and ranching, which are typical of a peripheral region. The city of Walla Walla has the political, economic, and educational power that serves the people of its local area.
Globally, we can apply the hinterland-city model to an understanding of a global core and a global periphery. The core areas are places of dominance, and these areas exert control over the surrounding periphery. Core areas are typically more developed and industrialized, whereas the periphery is more rural and generally less developed. Unlike the interactions between the city and the hinterland, the economic exchange between the core and periphery is characteristically one-sided, creating wealth for the core and patterns of uneven development.
Brain drain also happens on an international level—that is, students from periphery countries might go to college in core countries, such as the United States or countries in Europe. Many international college graduates do not return to their poorer countries of origin but instead choose to stay in the core country because of the employment opportunities. This is especially true in the medical field. There is little political power in the periphery; centers of political power are almost always located in the core areas or at least dominated by the core cities. The core areas pull in people, skills, and wealth from the periphery. The lack of opportunities in the periphery pushes people to relocate to the core.
However, these interactions do sometimes contribute to economic stability in the periphery. Some argue that it benefits the core countries to keep the periphery peripheral; in other words, if the periphery can remain underdeveloped, they are more likely to sell cheap goods to the core. This generates more wealth for core areas and contributes to their continued influence and economic strength.
The periphery countries and the core countries each have unique characteristics. Peripheral locations are providers of raw materials and agricultural products. In the periphery, more people earn their living in occupations related to securing resources: farming, mining, or harvesting forest products. For the workers in these occupations, the profits tend to be marginal, with fewer opportunities to advance. In the periphery, there is a condition known as brain drain, which describes a loss of educated or professional individuals. Young people leave the peripheral areas for the cities to earn an education or to find more advantageous employment. Few of these individuals share their knowledge or success with their former community.
9.3 IMPORTANT TERMS & CONCEPTS
People in more developed countries (MDC) and less developed countries (LDC) experience the world very differently, but let’s think about the meaning of such terms. MDCs tend to have higher incomes, levels of technology, infrastructure development, and life expectancies, while LDCs tend to have lower levels of those and other indicators. The simplest measure to consider is income. The World Bank (more on this institution later in the chapter) places countries into 4 categories. In 2017, low-income economies were defined as those with a gross national income (GNI) per capita of $1,025 or less in 2016; lower middle-income economies are those with a GNI per capita between $1,026 and $4,035; upper middle-income economies are those with a GNI per capita between $4,036 and $12,475; high-income economies are those with a GNI per capita of $12,476 or more. The map in Figure 9.2 displays the general geographic patterns associated with the 4 categories. Take a moment to look at the map to see if any of the countries or regions surprise you. For example, are all African countries in the same category? What about countries in Latin America or Asia? Which country is in a higher category, China or Russia?
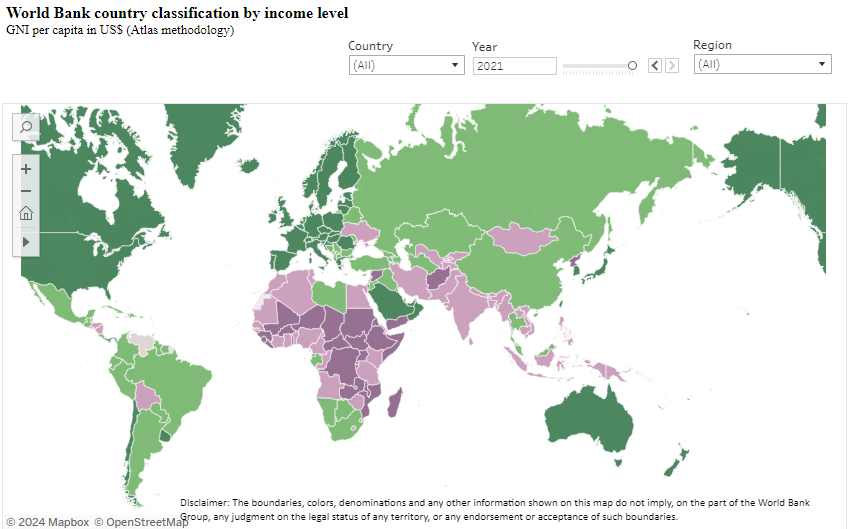
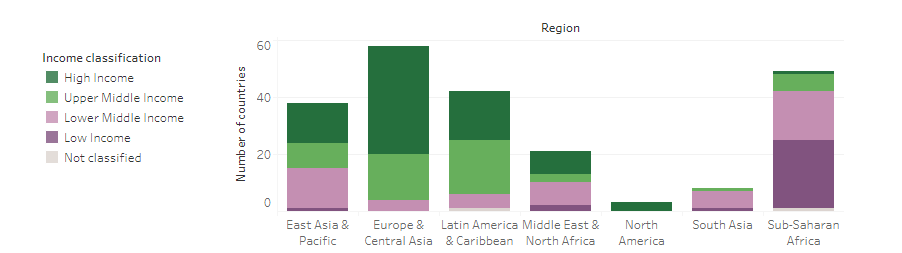
Figure 9.2 Income Categories for Countries as Defined by the World Bank in 20211; Author | Nada Hamadeh, Catherine van Rompaey, Eric Metreau, and Shwetha Grace Eapen, Mapbox and OpenStreetMap; Source | World Bank Blogs; License | CC BY 4.0.
Now that you have pondered these categories and spatial patterns, let us take a step back. What exactly is meant by gross national income? It is the sum of a nation’s gross domestic product (GDP) and the net income it receives from overseas. GDP includes all of the goods and services produced by a country in a given year and is calculated according to the following formula: Consumption + Investment + Government Spending + Net exports. So if a government increases spending on the military or road construction in a given year, that will increase GDP (and GNI). If a country imports a lot of things but doesn’t export many things, it will decrease that country’s GDP (and GNI). Finally, if consumers buy a lot of alcohol for New Year’s Eve, that will also increase GDP (and GNI). GNI also includes income derived outside of the country by members of the country. For example, Coca-Cola, headquartered in Atlanta, Georgia, earns profits in 200 different countries around the world. Those profits outside of the U.S. are not included in GDP, but they are included in GNI.
It is a little confusing, but this measure provides a valuable way to compare economic outputs between multiple countries and is the metric that is most often used in recent years. The total GNI for a country is divided by the total population of that country to arrive at a per capita figure, which includes children, the elderly, those imprisoned, etc. So, the per capita GNI figure does NOT mean that the average adult earns that amount annually as income, but rather it represents total income and economic output divided by the total population.
Some countries have a much higher than average overall GNI. Take a look at the cartogram in Figure 9.3, which shows countries represented, not by their physical size, but by the size of their respective GNI.
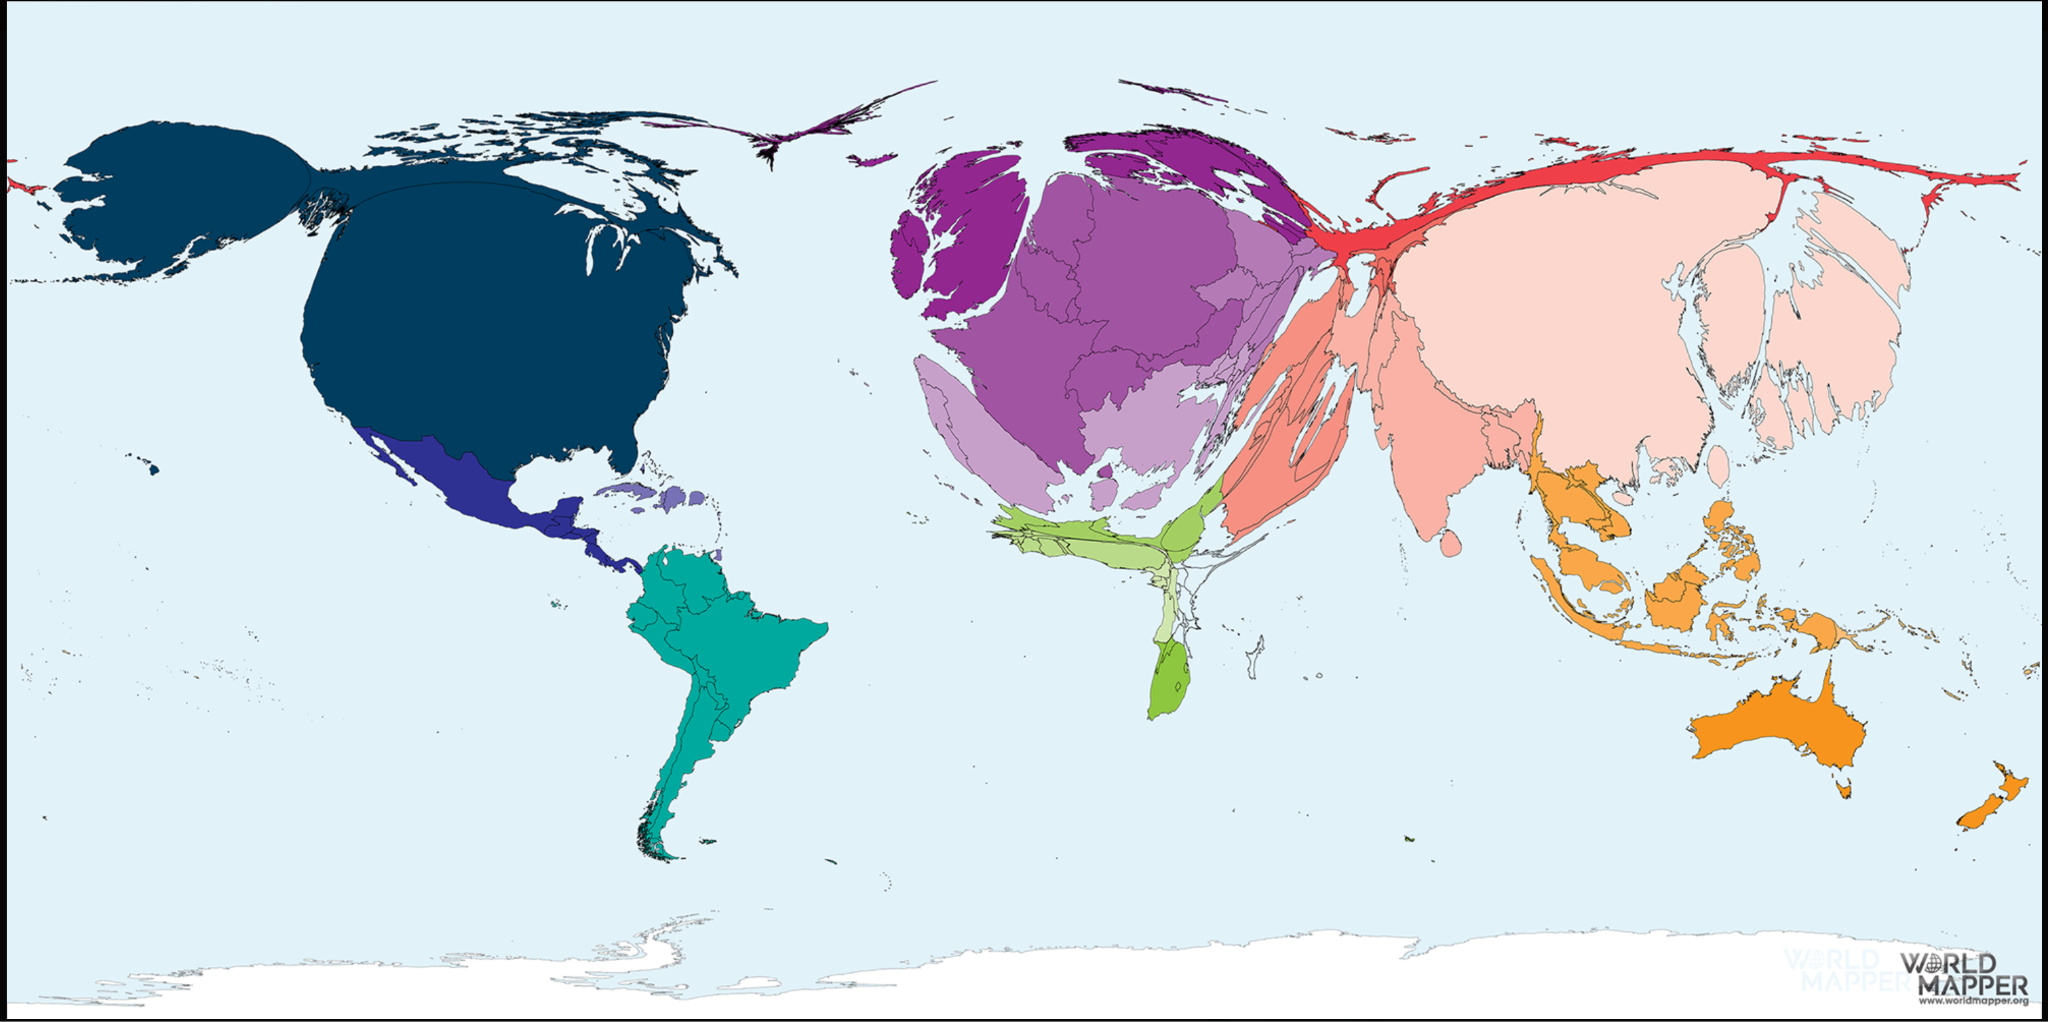
Figure 9.3 Gross National Income by Country 20182; Author | © Copyright Worldmapper.org / Benjamin D. Hennig; Source | WorldMapper; License | CC BY NC ND 4.0.
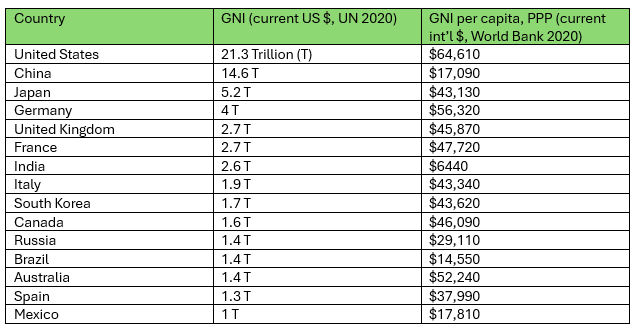
Figure 9.4 Top 15 Countries by GNI and Per Capita GNI by PPP, 20203; Author | World Population Review; License | Public Domain
A final important term useful to understand economic differences is Purchasing Power Parity (PPP). The PPP accounts for differences in the cost of living and goods between 2 places to allow for a more meaningful comparison. Think about it this way. If you earned $60,000 per year in New York City or in Lincoln, Nebraska, where would your salary be more valuable? Most items are cheaper in Lincoln, so your salary would be worth more there than in NYC. Similarly, the cost of living in Mexico is much lower than in Sweden, so the per capita GNI PPP numbers in the third column of Figure 9.4 account for such differences.
Learn More
If you are considering a move, you can check on salary equivalencies here:
Cost of Living Calculator—Forbes
GNI per capita, PPP (current international $)—World Bank Data
Now take a look at how the ranking of the top 15 countries in Figure 9.4 changes when considering per capita PPP (Figure 9.5). Can you think of reasons to explain why this might be? First, small oil-producing countries tend to have high incomes that are spread across a small population (e.g. Qatar, United Arab Emirates, Brunei). Secondly, countries with high incomes, high exports, and few children (e.g. Singapore and Switzerland) have high GNI. Thirdly, certain small countries attract very wealthy members of society to live there to avoid paying higher tax rates elsewhere (e.g. Switzerland, Isle of Man, and Bermuda). The difference between GNI and per capita GNI tends to be more pronounced in large, highly populated countries.
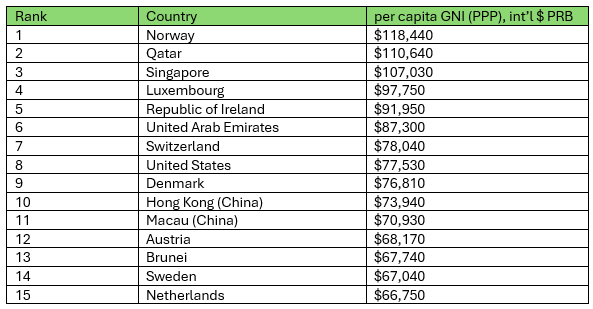
Figure 9.5 Top 15 Countries ranked by 2023 per capita GNI (PPP) demographic4; Author | J. Ibanez; Source | Population Resource Bureau; License | CC0 license.
9.4 GLOBAL, NATIONAL, REGIONAL, AND LOCAL PATTERNS
9.4.1 How Fast Does the Global Economy Grow, and How Much Money Is There in the World?
With 78 of the world’s more than 200 countries and territories categorized by the World Bank as high income and 64 are low or lower middle income, it is tempting to believe that wealth distribution might be relatively balanced in the world. After all, more people than ever are connected to the global economy. Instead, inequalities have been exacerbated by global capitalism in recent years. Jeff Bezos, the founder of Amazon, has a net worth of $148.2 billion, a figure that is larger than the annual GDP of 150 countries! Meanwhile, 9.2% of the world’s population in 2023 are living on a daily income of less than $2.15. Economic differences between most wealthy countries compared to most poor countries have widened over that same period rather than narrowed.
The number of those entering the formal economy rose dramatically during that period, so categorizing somebody as not in “extreme poverty” simply because they earn more than $2.00 a day is also quite problematic. The majority of those that rose out of extreme poverty were in just two countries (India or China), where hundreds of millions of people left unpaid work on subsistence farms and moved to cities, where they earned just a little bit of money. Does that make a country more developed or a person better off? In economic terms, the answer is yes, but in more qualitative terms, the answer is not quite so clear. The formal economy is defined as the part of an economy of which the government is fully aware and that is regulated by government authorities, particularly in the areas of contract and company law, taxation, and labor law. The informal economy consists of activities that have market value but are not formally registered, such as privately hired maids, child-care help, and landscaping workers who do have licenses or work for a registered business. If the government does not know you are working “under the table,” it cannot tax you, and so you are part of the informal economy.
The global economy has grown persistently since 1960, as evidenced by Figure 9.6, with the most dramatic growth occurring since 2000. Global GDP nearly doubled between 2002 ($34.6 trillion) and 2016 ($76 trillion)! So it took all of the economies of the planet tens of thousands of years to go from zero to $34 trillion, but then only 14 years to double that figure. Hmmm. Does this represent sustainable development—one that can continue? Moreover, can the planet handle the effects of continued growth, consumption, CO2 emissions, and water pollution across the world at such a persistent growth rate? Such questions are difficult to assess and will be dealt with more substantially in the last chapter of this text. For now, it’s important simply to understand that economic growth is just one of many indicators used to understand development and well-being, and the implications for economic growth come with complications. Finally, economic growth across the planet is uneven and difficult to predict. Despite what appears to be a fairly even upward movement in global GDP, one can see more clearly the complex nature of GDP growth in Figure 9.7, which shows the wild changes in growth that vary dramatically by place and time. In the 20 years from 1996 to 2016, Russia (an upper-tier country) experienced many years of negative growth, while Rwanda (the lowest-tier country) experienced rates of growth up to 14%, much higher than that of any other country. U.S. growth was negative in 2009 and has hovered around 2-3% in subsequent years. China’s annual growth, which had averaged 12% for several years, dropped to around 7%, where it is expected to remain into the 2020s.
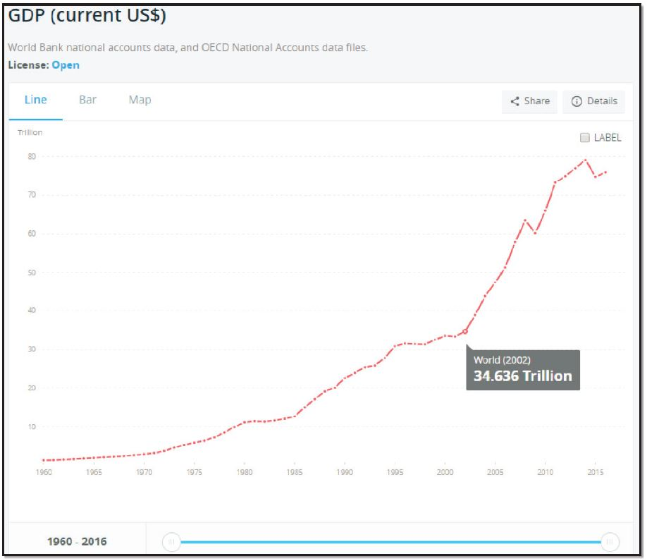
Figure 9.6 Gross Domestic Product 1960–2021 in current US$; Author | The World Bank; Source | The World Bank; License | CC BY 4.0.
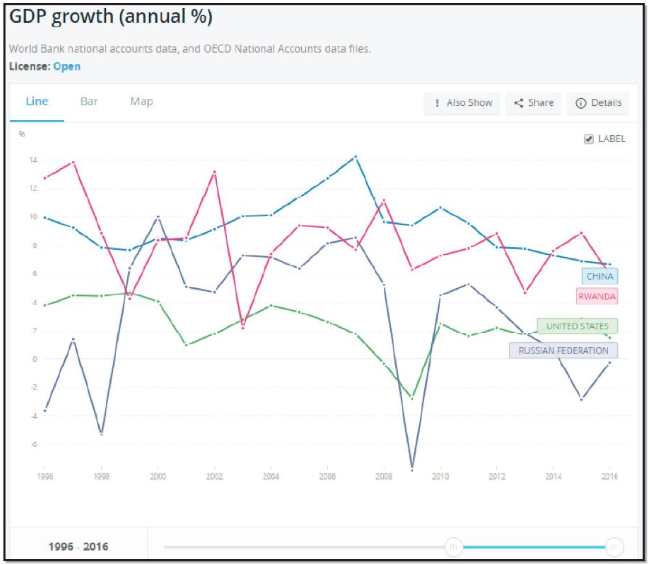
Figure 9.7 Annual Growth Rates in GDP, selected countries, 1996–2021; Author | The World Bank; Source | The World Bank; License | CC BY 4.0.
The most basic spatial patterns of wealth and income can be easily observed in the maps and figures presented thus far in this chapter. Wealthier countries tend to be those in the Global North (North America, Europe, Japan, Australia, New Zealand), while poorer countries tend to be in the Global South (everywhere else). However, such generalizations are problematic in truly understanding wealth and well-being around the planet. Let’s take a brief look at Latin America, for example. Mexico, by most accounts, is considered a developing country (another name for a “less developed country” that is on a pathway to improvement). It falls south of the Brandt Line and is considered poor by most American standards. However, its per capita income places it in the top third of all countries, and its economy is the 15th largest in the world. Carlos Slim, once the wealthiest person in the world, is Mexican, and its economic performance far outpaces all of its neighboring countries to the south. The difference in economic indicators between Mexico and Haiti, for example, is greater than the difference between Mexico and the U.S. As such, it is important to be wary of simplistic categorization schemes in terms of wealth and development. Moreover, in recent decades dozens of newly industrialized countries (NICs) have emerged that have reached or approached MDC status. Such places have moved away from agriculture-based economies to more industrial, service, and information-based systems. One example is a group of places known as the Asian Tigers or Asian Dragons (Singapore, South Korea, Hong Kong, and Taiwan), where massive investment in infrastructure and education facilitated an equally massive transformation of the economy in a very short period. South Korea, for example, lay in ruins at the climax of its civil war (1953) but has miraculously risen to a level of wealth similar to that of Italy. Another group of countries termed the BRICS (Brazil, Russia, India, China, and South Africa) fall outside of the Global North but have experienced dramatic economic growth, raising their collective share of the global economy from 11% to 30% in just 25 years. Those countries continue to wield more political power in direct relation to the rise in economic might, and this could shift the economic, social, and political landscape of the world in the coming decades. Another group of NICs is the oil-rich Gulf States of Qatar, United Arab Emirates, Saudi Arabia, Kuwait, Iran, and possibly a few others. Such entities have accumulated massive amounts of wealth as a result of absolute advantage, the abundance of rare and high-valued commodities. Other countries enjoy an absolute advantage due to climatic conditions for growing coffee, tobacco, tropical fruit, etc. The high price of oil and its concentrated supply, however, has facilitated massive economic growth in places that were traditionally poor and less developed than in recent years. Perhaps you are familiar with some of the recent development projects in this region of the world. The tallest building in the world (Burj Khalifa, Figure 9.8) and the world’s most ambitious set of artificial island construction projects (Figure 9.9) are both located in the United Arab Emirates (UAE) as evidence of the Gulf States’ development efforts in the 21st century.
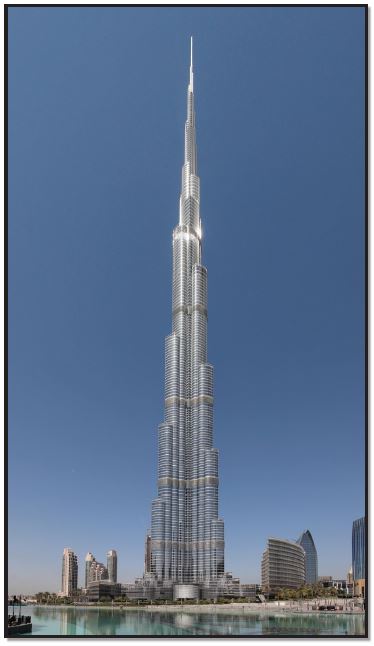
Figure 9.8 Burj Khalifa, Dubai, United Arab Emirates; Author | User “Donaldytong”; Source | Wikipedia; License | CC BY SA 3.0.
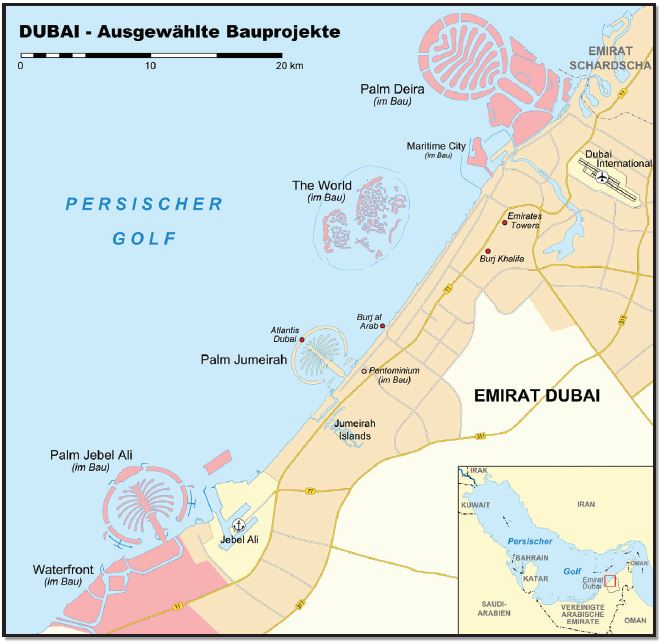
Figure 9.9 Artificial Island Construction, Dubai, United Arab Emirates; Author | User “Lencer”; Source | Wikimedia Commons; License | CC BY SA 3.0.
Despite the obvious wealth benefits that accrue in oil-rich or other resource-laden countries, they can also suffer what’s termed the Resource Curse (aka Dutch Disease), as the benefits of a highly valuable commodity do not spread to other members of society and violence/conflict emerge as groups fight over the resource. While income may be very high, millions of workers continue to face horrendous work conditions directly related to development efforts. In Qatar, for example, thousands of workers have died during the massive construction of new stadiums and other infrastructure required to host the World Cup in 2022. Other examples of the Resource Curse can be found in Nigeria (oil), South Africa (diamonds), and the Democratic Republic of Congo.
9.4.2 How Does a Country Improve Its Wealth and Well-Being?
9.4.2.1 The International Trade Model
The characteristics of this model are quite simple on the surface. In this strategy, a country embraces free trade (removing barriers to all imports and exports in a country) and willingly participates in all facets of the global economy. The basic benefits of the strategy are as follows:
- Potential high ROI (return on investment)
- Increased specialization leads to technological advantages
- Simplified development strategy
- Less government involvement
Libraries of books have been written about the transformative power of capitalism, and other libraries of books have criticized the system. The international trade model asserts that trade between nations is the best way to bring about mutual prosperity for all. As a country removes trade barriers, there will invariably be winners and losers, but classical macroeconomic (the branch of economics that focuses on entire systems rather than individuals or firms) theory posits that the overall benefit will be greater than the losses. The U.S. has championed the strategy since the end of WWII (1945) as it encouraged allies, neighbors, and adversaries to open borders, allow imports, and reduce controls on the free exchange of goods and services between countries. The European Union has done the same as it moved towards a common currency and a free flow of goods and services throughout Europe. The Asian Tigers and BRICS also embrace the global trade system to various degrees, having gained enormous growth in wealth following a recipe that calls for an intensive export-oriented economy.
Countries following the strategy remove domestic producer subsidies and allow global competition to decide the “winners” and “losers.” As such, countries must find specific services and industries in which to gain specialization. South Korea, for example, elected to focus on low-end electronics initially before moving into other sectors such as shipbuilding and automobiles. Initially, the products were inferior to those produced elsewhere, but with each generation, it improved its workforce, technical knowledge, and facilities until it gained a comparative advantage (the ability to produce particular items/services more efficiently than competitors given all the alternatives) in those industries. Specialization requires a lot of practice with an intensity of focus, investment, and time to gain price and quality competitiveness on the global market, but if done correctly the rate of return on investment can be very high. For example, in the post-Korean War era (circa 1953), South Korea transitioned away from an economy based mostly on farming to become the 7th leading exporter in the world, specializing in cars, auto parts, ships, and integrated circuits. Moreover, the technological knowledge can then be used to foster other industries. Under this strategy, governments don’t try to protect certain companies over others, and since tariffs are removed, it simplifies the development strategy.
As countries gain comparative advantages in certain areas, they also tend to relinquish efforts in other areas. For example, as Japan focused on developing its industrial sector after WWII, it focused less on agriculture, depending increasingly on imports from other countries. Such a trade-off is termed opportunity cost in that choosing to do one thing prohibits you from doing something else. During the 1980s era, the United States aggressively pursued an international trade model that allowed for more manufactured goods to be imported into the country. People working in areas like steel production and coal mining began to see their job opportunities diminish as more foreign goods entered the U.S. economy. Proponents of the system argue that such workers need to adapt and become re-trained in other high-paying professions to escape the pain that comes with economic transformation. Can you think of other industries or jobs that suffer as a result of a country’s choice to follow the international trade model? A few other negative aspects of the strategy are:
- Susceptibility to unpredictable global markets
- Loss of local control
- Uneven benefits to the population.
Take a look at Figure 9.10. The dramatic price shift (first upward and then downward) represents the dramatic risk associated with global trade. For a farmer who has shifted away from food production and into palm oil (as did millions of farmers in Indonesia and Malaysia in the 2000s), this price drop is more than just economic theory. It can be the difference between living and dying. Focusing on a few key industries or products within a country comes with serious risks. What if prices drop unexpectedly or global preferences for certain products change without warning? Somebody gets left holding the bag, and such shifts are very common in many commodity chains, with those at the bottom suffering the most serious consequences.
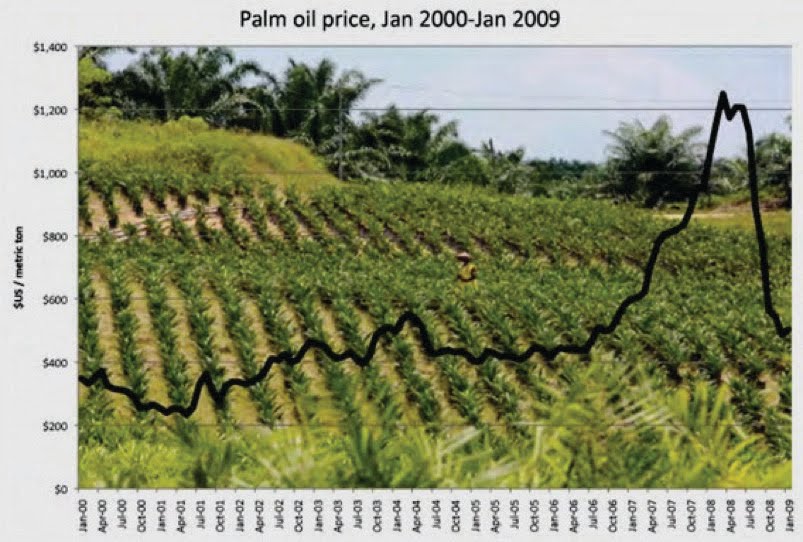
Figure 9.10 Palm Oil Prices, 2000–2009; Author | Todd Lindley; Source | Original Work; License | CC BY SA 4.0.
The second risk, loss of local control, occurs when countries have entered into free-trade agreements such as the North American Free Trade Agreement (NAFTA/USMCA) between Mexico, the U.S., and Canada. As U.S. corporations increasingly began to relocate production to Mexico, American workers’ calls for politicians to intervene went unanswered because the agreement prevented state or local governments from taking intentional actions to protect jobs or to keep companies from moving.
Finally, international trade has generated significant growth in production and wealth, but it also brings new competition that disrupts local economies. While customers usually benefit from lower prices of imported products, many local producers lose their livelihoods entirely. As the U.S. lost manufacturing jobs to Mexico, more than 2 million small-scale Mexican farmers also lost their jobs, as Mexican corn could not possibly compete with the low-cost, mass-produced crops from the U.S. and Canada. Corn exports to Mexico in 2016 were 5 times higher than in the year before NAFTA and subsequent reworking into the USMCA. It is not an accident that rates of immigration from Mexico to the U.S. increased dramatically during the same period. As farmers lost their jobs, they moved in search of new ones.
9.4.2.2 The Protectionist Model
As you probably have guessed from its name, the protectionist model (also known as import substitution) requires that countries sustain themselves without significant trade with other countries. Protectionist policies are applied to safeguard domestic companies from foreign ones. The theory behind this strategy is grounded in the idea that over-reliance on foreign labor, products, and/or services can be detrimental to national sovereignty and/or security. As such, the strategy became very popular among countries that gained independence after many years of imperialism and colonization. India, Jamaica, the Philippines, the former Yugoslavia, the former Soviet Union, and most countries in the Caribbean and in Africa embarked on this strategy from the 1950s-1980s. Yugoslavia, for example, produced its car, called a Yugo, and India did the same. These automobiles were designed to be affordable for domestic consumers, but in both cases, the strategy failed to produce a reliable, affordable product and left consumers without access to better alternatives imported from Germany, Japan, or the U.S.
Protectionism is closely tied to nationalism in many cases as politicians and/or consumers ask the basic question, “Why don’t we take care of ourselves, by ourselves, rather than depending on workers and producers from other parts of the world?” How does this question relate to your own opinions about whatever country you live in or were born in? Does the argument make sense to you?
By the 21st century, the vast majority of countries in the world turned away from protectionism as a strategy in favor of adopting an international trade-oriented economy. Nonetheless, protectionism does offer certain advantages worthy of consideration such as:
- More controlled decision-making
- Benefits spread to more members of society
- Help grow local markets and reduce dependency on exports
- Increased the number of national industries and grew employment
- More government involvement
- Increased national food security
Decision-making by governments can be more controlled, policy decisions can be easier to make, and policies can be designed to benefit and spread to more members of society under protectionism. Until 1993, for example, corn farmers in Mexico were protected from cheap corn produced in the U.S. and Canada because of restrictions on imports. Most of the millions of small-scale corn farmers in Mexico could grow enough corn for their own families and produce a small surplus to be sold locally, providing a small but meaningful wage for millions of families. Protecting farmers from outside competition offered a measure of predictability, political stability, and food security from one year to the next. Mexico is also blessed with generous reserves of oil, and traditionally the government has controlled domestic oil and gas prices, which again can bring a certain level of predictability to consumers as opposed to the wild shifts in prices that can often accompany imported oil.
Disadvantages to this isolationist strategy are probably apparent to you as you read and think about this topic. A few of them are listed here:
- Susceptibility to corruption, inefficiency, and slow response to market conditions.
- Lacking creativity and innovation.
- The absence of natural resources in some places necessitates trade to meet the demand.
- Market distortion and loss of economic efficiency. Protectionism can be an ineffective and costly means of sustaining jobs and supporting domestic economic growth.
- Higher prices for consumers. Import tariffs in particular push up prices for consumers and insulate inefficient domestic sectors from genuine competition. They penalize foreign producers and encourage an inefficient allocation of resources both domestically and globally.
- Higher prices from tariffs tend to hit those on lower incomes hardest because the tariffs (e.g. on foodstuffs, tobacco, and clothing) fall on products that lower-income families spend a higher share of their income. Tariffs can therefore lead to a rise in relative poverty.
- Export subsidies depress world prices and damage output, profits, investment, and jobs in many lower and middle-income developing countries that rely heavily on exporting primary and manufactured goods for their growth.
When a government protects a company from outside competition, there is a tendency for that company to become susceptible to corruption. Since 1938 a single oil company called Pemex had exclusive rights to drill, process, and sell oil within Mexico, which provided a huge source of revenue, protected jobs, and helped build national pride. In recent decades, however, the company increasingly found itself entangled in one scandal after another involving bribes, kickbacks, and various schemes that have kept gasoline prices at the pump artificially high. In 2013, however, Mexico began reforms known as market liberalization (a process of removing barriers to foreign-owned companies from operating and competing with domestic ones), allowing BP, Shell, and other companies to import petroleum and open gas stations in certain parts of Mexico. Such a shift is having a serious impact on the national landscape both symbolically and materially as residents have a choice between competitors for the first time in 80 years!
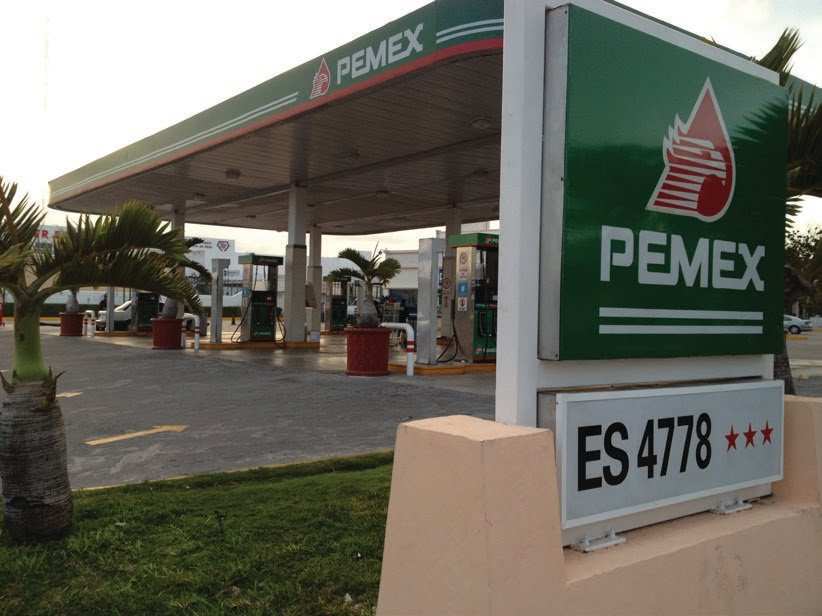
Figure 9.11 Nationally Owned/Operated Gas Stations in Mexico; Author | User “Diaper”; Source | Flickr; License | CC BY 2.
Aside from corruption, another drawback to isolationism is the lack of creativity and innovation that otherwise comes from fierce competition. Venezuela, a country that has resisted international trade in favor of protectionism, currently is suffering from massive shortages in food and other necessary consumer items as domestic producers have failed to innovate and respond to consumer demand. Meanwhile, global supply chains of rice, beans, corn, tomatoes, mangoes, coffee, sriracha sauce, and fidget spinners have constantly evolved, innovated, and changed to efficiently provide for the demands of consumers internationally whether they happen to be in Sydney, Seoul, Santo Domingo, or São Paulo! It is very difficult for governments to plan for and anticipate the needs of an entire society for any length of time. Protectionism requires a government that can match consumers and producers efficiently, a task often handled much better by free-market forces than by public officials.
The final element that makes protectionism so problematic rests in simple geography. All countries have different conditions related to the site, situation, climate, or natural resources, so trade isn’t just advantageous, but rather it is essential to survival. An extreme case can be found in North Korea, a country with notoriously tightly controlled borders. Without trade the country routinely fails to produce enough rice, leaving millions desperate and undernourished. Likewise, China faced similar droughts, food shortages, and periods of starvation when it favored protectionism for most of the 20th century, but it began to reverse its strategy as it cautiously opened its economy to the rest of the world in the early 1980s.
9.4.2.3 The 2 Models in Global Context
After reading the brief summaries of the 2 models above, you might ask yourself why any country would choose a protectionist model, given the obvious advantages and drawbacks of each. Most economists say the same thing. We need to exercise caution with overly simplistic conclusions, however. Here is where geography and history are worth careful consideration. Let’s begin with Caribbean islands (most of them anyway). The majority of Caribbean countries were colonies until just very recently (1960s onward). During the colonial period, European powers established a monoculture (agricultural system heavily focused on a single item) plantation economic system in which particular islands or territories focused exclusively on one item such as sugar, bananas, or pineapple. Upon independence, many of these former colonies found that they had very little diversity in their domestic economy, meaning that even after earning their freedom they were still almost entirely dependent upon the former colonizer economically because the plantation economy created a relationship of dependency. The concept of dependency theory explains the economic problems experienced by former colonies as a function of the disadvantageous terms and patterns of trade established over hundreds of years. Look at it this way. If all of the grocery stores around you closed permanently, would you be able to head into the wilderness tomorrow to find your food? Would you know which berries are safe and which are poisonous? Probably not. This was the situation in which many former colonies found themselves, so it made sense for them to attempt to protect themselves from outside competition while domestic companies could emerge and develop. Moreover, world systems theory suggests that the global system of trade only works as long as there is a persistent set of winners (more developed countries), who most benefit from low-cost production in poor countries, and losers (less developed countries) that provide a readily available supply of laborers willing to work long hours for low wages.
While many countries have benefited from the international trade model, others have been damaged by their participation in global competition. Ethiopia’s largest export, for example, is coffee, and although retail prices for a cup of coffee have increased dramatically, the incomes of coffee farmers in that country have not reaped any of those benefits. Instead, prices paid for coffee beans have routinely been set by foreign commodities markets that tend to undervalue the product and harm small producers, leaving only large producers with a meaningful profit. Although just 3 cents more per kilo could bring these farmers out of poverty, global markets don’t account for such disparities. One remedy for such a complicated problem is fair trade, a system that guarantees a basic living wage for those at the very bottom of the global production cycle.
Another meaningful problem with global trade is that it can be very disruptive and unpredictable. Following years of state-controlled markets, Russia began to open itself to foreign competition and free-market reforms after 1989. While Western countries applauded the decision, many people in Russia suffered as they experienced a lower quality of life, loss of jobs, and massive economic and political instability. Social problems, most notably high unemployment and alcohol abuse, began to dominate society as life expectancy dropped significantly for Russian men, many of whom could not adapt to the new demands of a fully market-based economy.
In summary, the decisions made by any country about the best path to increase development are not so clear. Leaders and policy-makers face very difficult, often contradictory decisions that vary from place to place about how to make things better for citizens and residents. Moreover, what might be good in the short term can be problematic in the long term. For example, Jamaica’s decision to protect its farmers from outside competition benefitted local farmers in the short term, but the island government’s subsidies to farmers proved too costly for the government in the long term. When the money ran out, the country found itself in crisis. Collectivist societies are particularly threatened by international trade models in that many traditional forms of society do not encourage competition, but rather they value cooperation for the good of the group over the desires of any individual. Finally, any development strategy that values short-term benefits over long-term costs is problematic. As India and China have embraced international trade, for example, unprecedented levels of air and water pollution have become the norm in Shanghai, Bombay, Delhi, and Beijing (among others).
Sustainable development is a strategy that balances both current and future benefits and costs and attempts to balance them with any possible environmental damage (e.g. oil spills, loss of habitat, erosion, increased pollution, dangerous waste) that might occur.
9.5 ROSTOW’S STAGES OF GROWTH AND POLITICAL POLICY
Do all countries follow a similar pattern of development over time? This is a simple question that does not have a simple answer. Just as different people each follow different career paths, depending upon their unique talents, strengths, and weaknesses, the same is true of countries. While the Asian Tigers have successfully demonstrated the power of embracing an export-oriented economy, countries like Brazil, Jamaica, and South Africa have also embraced global trade but failed to achieve similar results despite grand efforts and reforms. Nonetheless, the dominant and consistent advice from Western countries (in the Global North) is for poorer countries to reject protectionism in favor of trade and globalization. Much of the debate is informed by economic theory that argues that the more we trade with one another, the more stuff there is for all of us—and who doesn’t want more stuff, right? A leading proponent of trade was an American government official named Walter Rostow, who developed a model known as Rostow’s Stages of Growth in 1960. He argued that countries historically follow a similar and predictable pathway to wealth and stability and that each country is in one of the 5 stages of growth described below:
- Traditional Society: characterized by subsistence agriculture with intensive labor and low levels of trade in which most live on small farms and are mostly focused on local concerns and remain largely disconnected from the rest of the world.
- Preconditions for Take-off: initial manufacturing stage, the beginning of trade, new ideas, the emergence of banks, but society is still dominated by tradition.
- Take-off: a short period of massive disruptive societal change, in which industrialization accelerates, and high profits are reinvested in new technologies, often brought on by external forces.
- Drive to Maturity: this takes place over a long period; as standards of living rise, economic growth outpaces population growth, the use of technology and education increases, and the national economy grows and diversifies.
- Age of High Mass Consumption: final stage, in which most enjoy the luxury of consuming far more than they need. Advanced economies have a surplus that can be used to increase social welfare and reduce risks to society. (Rostow believed the U.S. had reached this stage in the 1920s, Western Europe and Japan in the 1950s, and the Soviet Union could potentially reach it if it changed its political system.)
Rostow’s ideas represent the concept of modernization theory, which is the widely held belief that, with the proper intervention, each country will pass through a similar pathway of development. Modernization geography recognizes the large disparities that exist from one place to another across the globe and represents an attempt to bring prosperity to places that have been left out or left behind. The goal to address such differences worldwide represents a shift in scale from one in which each country looks after itself to a new paradigm in which wealthy countries feel a keen responsibility to “bring” development to those across the world, in what’s been dubbed the “development project.” The best evidence of this global effort can be seen in the Millennium Development Goals, which were a series of 8 measurable outcomes decided upon by 189 world leaders in 2000 that were to be achieved by 2015. Although not all of the goals were achieved, significant progress was demonstrated across most of the 8 goals. Much of the progress, however, has been found in Asia—most notably in China, where nearly 200 million people have left farms and moved to cities to work in manufacturing jobs, which pay far more than what they could earn as farmers. Critics of Rostow’s model point out that it doesn’t account for geographic differences, historical variations, or the long-standing effects of colonialism, and they also argue that the model is more of a political document (critical of communism and triumphant of capitalism) than it is a serious economic blueprint for success. Nonetheless, efforts have been spearheaded by Europe and North America to jumpstart all economies of the world into action, so that all can eventually reach the age of high mass consumption.
- Can you identify any problems with this model?
- Is it possible for all countries of the world to live in a state of high consumption?
- Why or why not?
What do you think might be the biggest obstacle to development by poor countries today? It’s the same obstacle that keeps you from going out to dinner every night—MONEY, of course! But the kind of money we’re talking about in this case is not available from a regular bank. For that reason, the World Bank was formed in 1944 to provide funds to countries for large development projects. For example, a World Bank loan financed the construction of the Tarbela Dam (1977)—see Figure 9.12. One of the largest in the world, the structure facilitates irrigation, helps to control flooding, and (most importantly) provides significant amounts of hydroelectricity to the region in Pakistan along the Indus River. Such projects are often controversial, however. During its construction, the dam displaced 120 villages, and many claimed to have never received the compensation they were promised. Similar projects can be found all over the world, and most of them are designed to improve people’s daily lives while also greasing the wheels of global commerce.
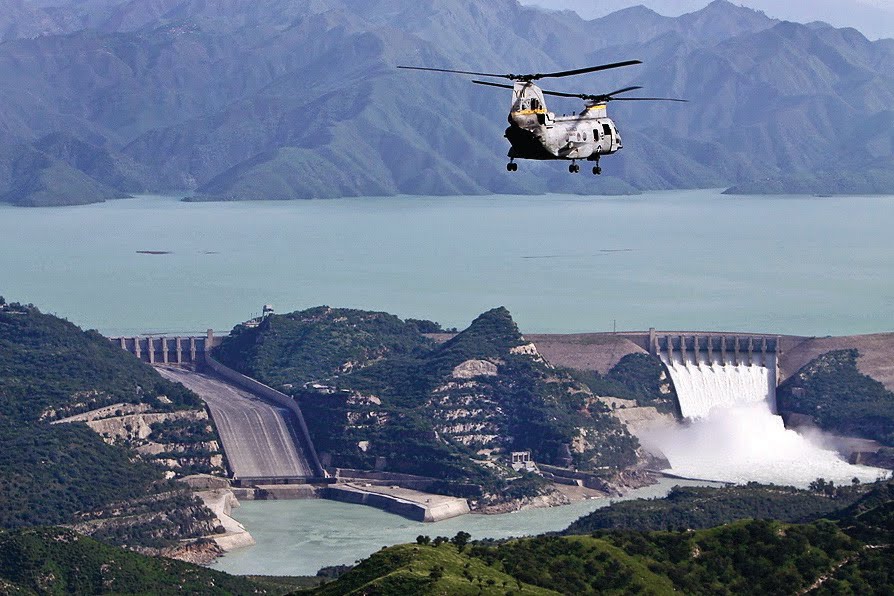
Figure 9.12 World Bank Financed Tarbela Dam in Pakistan; Author | Paul Duncan, U.S. Marine Corps; Source | Wikimedia Commons; License | Public Domain.
Another source of funding to governments comes in the form of emergency loans, usually from the International Monetary Fund (IMF). The IMF is funded primarily by wealthy private sector banks and offers loans during times of financial crisis. The loans are smaller than those from the World Bank and are not designated for national infrastructure projects; rather they are intended to maintain stability when a country may otherwise be vulnerable to political revolution, dictatorship, or collapse. Such loans, however, come with strings attached. The borrowing country must agree to a series of structural adjustment programs. Namely, countries must:
- Privatize government-owned assets (such as oil companies, utility companies, or diamond mines)
- Reduce spending on government programs (such as social services, food programs, or military spending)
- Open themselves up to foreign investment and foreign competition (such as the case with Mexico and Pemex)
The result of accepting an IMF loan, then, nudges that country away from the protectionist model of development and towards one that focuses on international trade. Most often, a country following the adjustments will experience a devaluation of their currency, making imports more expensive, but exports more viable, which can be very beneficial to manufacturers searching for new, lower-cost manufacturing locations around the world. As with any major change to an economic system, there will always be big winners and big losers. The same can be said for structural adjustment programs and the IMF.
9.6 NEW MODELS OF DEVELOPMENT
9.6.1 Is There More to Life Than Money?
This may seem like more of a philosophical question than one you’d find in a geography textbook, but it is an important one to consider. In the previous section, we learned that the end-point of development is to arrive at a state of high mass consumption relying primarily on indicators of wealth, income, and production to evaluate one place compared to another. Do you think this is a fair assessment, or are there other ways to gauge development? Think about some of the things that make you feel good or bad about any particular place. Does it have good parks, safe roads, low levels of traffic, or lots of fun things to do? While some of those things are connected to income and wealth, some markers of development do not necessarily have to be connected to wealth.
Indian economist and Nobel Prize winner Amartya Sen argued that our understanding of development needed to be dramatically altered to include a capabilities approach to measuring, encountering, and improving people’s lives. In his book Development as Freedom, Sen argues that abject poverty comes from a lack of rights and the absence of freedom that are very different from simplistic notions of wealth and poverty. For example, a country that produces a lot of oil like Saudi Arabia may demonstrate high GDP growth, but if it does not positively affect the lives of most people in the country, then the GDP is not improving people’s lives in a meaningful way.
As obvious as it may sound today, this transformative thinking drove the United Nations to redefine thinking on development as the organization unveiled its first annual Human Development Report (http://www.hdr.undp.org) in 1990, which incorporated a brand new index, called the Human Development Index (HDI) (Figure 9.13). Instead of relying solely on income, the index is derived from indicators of 1) life expectancy, 2) adult literacy, 3) school enrollment, and 4) income to provide a meaningful comparison for almost all countries (a few countries like North Korea choose not to participate). The index provides a reason for optimism in that 105 countries are now categorized as “very high” (51 countries) or “high” (54) human development with an HDI of .70 or higher.
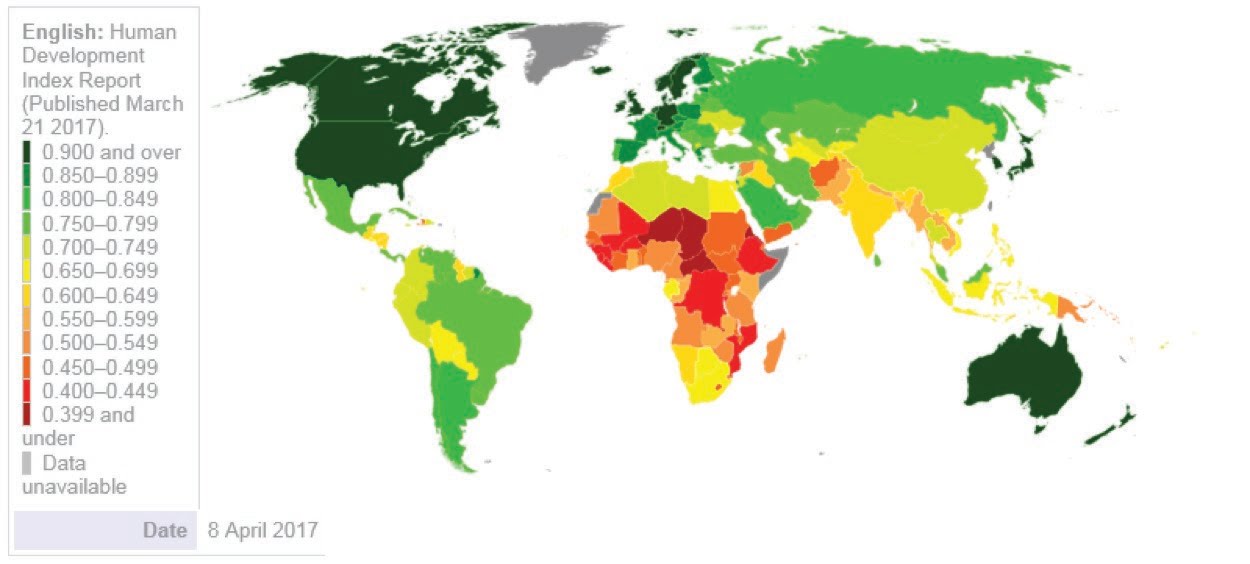
Figure 9.13 Human Development Index (Based upon 2016 Human Development Report); Author | User “Happenstance”; Source | Wikimedia Commons; License | CC BY SA 4.0.
You can view the entire list of countries here: http://hdr.undp.org/en/ composite/trends, and the regional trends over time are included in Figure 9.14, which shows that the areas with the greatest improvement since 1990 have been East Asia and South Asia. Most notably, China moved from low human development to high, and India moved from low to medium during the short period from 1990 to 2015. Sub-Saharan Africa contains the majority of those with the lowest levels of human development, but nearly every country experienced persistent improvement since 1990. Moreover, developing countries everywhere have seen improvements in educational access and life expectancy during the past 50 years. HDI helps us to quantify those improvements over time.
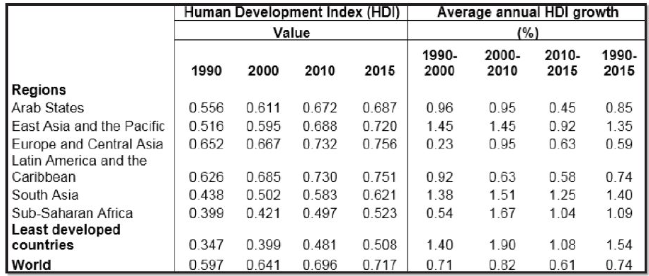
Figure 9.14 Human Development Index Trends by Region and Time Period; Author | United Nations Development Programme; Source | United Nations Development Programme; License | CC BY SA 3.0
One final point about this index is that some countries do a very good job of providing human development, despite low income. Consider Mexico and Cuba, for example. In both countries, incomes are low, but life expectancy is high. In the case of Cuba, life expectancy is higher than it is in the U.S. Cuba has followed a protectionist strategy for several years, which has limited financial growth, but its provision of healthcare and education gives it a higher HDI than would otherwise be predicted. Meanwhile, countries like Kuwait and others in the Middle East enjoy high incomes but lower levels of development when measured by the index.
HDI also has its limitations since it uses only 4 indicators. Can you think of some other measure that might be meaningful? Some examples might be gender empowerment, levels of inequality, or simply quality of life. Other indexes measure such things as access to the Internet or to modern sanitation systems. Among those living in rural areas of India, for example, only one-quarter of the population has access to a working toilet. The Population Reference Bureau (http://www.prb.org/DataFinder) collects data on these and other indicators by country that are readily accessible. You are encouraged to check out the website to find out more of these!
It is also important to keep in mind that differences within countries can be very stark. People living in Shanghai, China, for example, enjoy a standard of living very similar to the average Italian. Meanwhile, rural dwellers in that country are not much better off than an average person from Sub-Saharan Africa. Just as many rural residents in Tennessee, Mississippi, and West Virginia struggle with access to basic health care and have unemployment rates much higher than in other parts of the U.S. The small country of Bhutan has taken a novel approach to measuring its development by considering one factor above all others—happiness. Rather than measuring GDP, it closely monitors gross national happiness as a barometer of the spiritual, physical, social, and environmental health of its citizens and natural environment. As stated by the Minister of Education, “It’s easy to mine the land and fish the seas and get rich. Yet we believe you cannot have a prosperous nation in the long run that does not conserve its natural environment or take care of the wellbeing of its people.”
As you may have noticed, none of the indicators of development presented in this chapter take into account the well-being of the environment or the long-term cost of development. As people become wealthier, they consume more of the earth’s resources. The Bhutan model might seem a little strange to the average American student, but it is one of the few models that takes seriously the notion of environmental sustainability as a component of development.
9.6.2 What Is Micro-finance?
Inherent in all forms of development strategies is the importance of money. Previous sections described how the World Bank and the IMF offer development assistance to developing countries. Both of those entities are limited to relatively large-scale projects, however. In recent decades a new form of development assistance has emerged that has proven much more impactful at the local level. The term micro-finance refers to all of the financial services normally available through a bank to the wealthy around the world. These include credit cards, short-term loans, interest-bearing accounts, and financial insurance. Something as simple as a credit card that allows a college student to buy books (not this book, however!) can be the difference between staying and leaving college. Small-scale farmers in less developed countries are at constant risk when they do not have access to such credit. With even a very small loan, or micro-loan (e.g. $500), hundreds of millions of farmers can increase their income significantly. If you sell milk but only own 3 cows, imagine what you could do with 6 cows! Large-scale development programs don’t offer such things to individual farmers, but new programs and websites are doing exactly that. Perhaps the most well-known among these is Kiva.org (http://kiva. org). What started as a small endeavor to match lenders and borrowers by 2 people has morphed into a major provider of loans to more than 100,000 people in 2016 while raising nearly $150 million. Most incredibly, the repayment rate of loans given to the poorest of the poor stands at 97%, an astounding accomplishment.
9.6.3 Paths to & Funding of Development
There are many different approaches a country may take towards development. These may include top-down or bottom-up development and may strive more toward self-sufficiency or international trade.
Top-down development may include projects initiated and funded at the federal level, whereas bottom-up development may include projects (infrastructural development, social aid programs, educational initiatives) that emerge from a group of people at the local level and are carried out from there.
Taking a self-sufficiency path toward development means that a country places primacy on limiting/eliminating foreign influence in the domestic economy. Two ways this is typically done is by limiting the ownership of business by foreign companies and increasing tariffs (taxes) on imported foreign goods and services. Import substitution refers to when domestically produced items come to replace imports.
Countries that take the international trade path towards development, in contrast, focus on amplifying their production of a few key resources, products, or services and competing on the international market. Foreign business presence in the country is not limited, and the goal is not to eliminate imports
All paths and approaches to development require funding, which often comes through any combination of the following:
- Foreign Direct Investment (FDI): when a foreign country or company provides funds for a domestic project
- International Monetary Fund (IMF): provides loans to countries specifically to expand their presence within international trade
- World Bank: provides loans to countries for development purposes
- Micro-credit/micro-financing: when banks provide tiny loans to individuals who would otherwise not qualify for traditional loans
9.6.4 Globalization & Economic Geography
In the current iteration of globalization, which can be understood as increasingly intensified interconnectedness among people and places across economic and socio-cultural dimensions, the way that national economies work has vastly changed.
One way to understand how is to borrow the term space-time compression, foregrounded by geographer David Harvey. Space-time compression refers to the idea that the world is getting smaller due to the reduced time it takes to travel (in reality and virtually) through space.
As space-time compresses, what happens to the uniqueness of place? As the world gets “smaller,” is the world becoming a single place? To some degree, yes. There are places separated by vast distances that have similar looks and feel. If you are traveling the world, there is a decent chance you can still encounter Americanized fast food, with its familiar packaging. You likely might hear the same songs popular back home. But this is far from the full picture; in many ways, place differentiation is being heightened by globalization. Regional and ethnic differences can become more valuable as cultural diffusion eases. The further transnational corporations (see below) reach, the more they may respond to place-to-place differences.
Some factors that have led to the current landscape of globalization include transnational corporations (TNCs), which operate in multiple countries, and the associated outsourcing of labor to areas where labor is less regulated and cheaper to obtain. Examples of this include how Apple outsources labor to China to produce the iPhone, as exemplified by the Foxconn factory in Zhengzhou, China, and maquiladoras, or foreign-owned factories in Mexico that produce tax-free products for US export. For considerations about what it’s like to work in the maquiladora industry, which overwhelmingly employs women, read this synopsis for the movie Maquilapolis. Some see globalization as neocolonialism: a process in which former colonies, now new independent countries, are still controlled economically and politically by core countries. This is an informal rule, rather than the formal and direct rule of core countries over colonies. The informal rule is enforced via international financial regulations, commercial relations, and covert intelligence operations. At the same time, corporations in core countries grew larger and became transnational, themselves being able to exert financial pressure on peripheral countries.
To illustrate the truly global scope of international economic integration and contemporary globalization, it is common practice among economic geographers to chart commodity chains, which show from where all the parts of a fabricated product come. Products of everyday use may travel tens if not hundreds of thousands of miles to reach their final destination. This is made possible by the effects of consumption. Wealthy people and regions can consume more, and corporations can reduce prices through outsourcing. Not only are products and components outsourced, but so too are labor and pollution. Look at cotton; the United States ranks first in cotton production around the world by far. However, most cotton-based apparel sold in the United States was imported from abroad. How does that make sense? While the US produces the raw product (with the help of government subsidies), corporations that need the raw product to create finished clothes ship it overseas. The corporation saves on labor costs through international outsourcing, plus the United States saves locally on greenhouse gasses and other pollution associated with the manufacture of clothing. The final product is then shipped and brought back to the US, in some cases at a low cost for end consumers.
Learn More
Click here to view an interactive map charting the commodity chain of Nike shoes.
9.6.5 What Does the Future Hold For Development Around The World?
Predicting the future is always risky. Climate change, emergent untreatable diseases, and massive political upheavals have historically altered the course of history beyond anyone’s imagination. Those caveats aside, the immediate future is expected to be a good one when measured by the Human Development Index. As total fertility rates decline across the developing world, women’s empowerment will also increase. As more women enter the workforce globally, family incomes are expected to continue to rise. The overarching story of the 20th century was that life expectancies skyrocketed, infant mortality rates declined, and the spread of many communicable diseases was curtailed. Economists argue that, as more countries increase their connectivity to the global system via trade, the wealth of everyone increases. As hundreds of millions of farmers left the countryside in China and India to seek manufacturing jobs, levels of development increased dramatically. Many predict that the same spatial pattern will occur in Africa and in other parts of the world in the coming decades as manufacturers seek new markets and new, lower-cost labor deep into the 21st century. Many of the improvements worldwide are directly connected to technological improvements. Anyone with an Internet connection in 2018 has access to more information, imagery, and knowledge than average people had throughout their entire lives even just one generation ago. As globalization allows for the free flow of information, commerce, currency, and ideas, there is also an increased risk that dangerous things travel along those same routes. The dark web makes for easy illicit exchanges of drugs, weapons, stolen credit cards, human trafficking victims, and all sorts of other horrible things. The challenge for development in the future lies in balancing the risks and benefits of a world that has experienced such a massive time-space compression in such a short period.
9.7 SUMMARY
In some ways, trying to describe and understand all facets of development around the world is a ridiculous task. The previous sections of this chapter barely scratch the surface, and yet the major questions about development are quite simple. Is it better for a country to be intricately connected to the global economy and to willingly import and export lots of things? Or is it better to close oneself off, protecting your own from the potential dangers of the outside world? History seems to be on the side of openness, but that also carries serious risk. Governments can spend huge amounts of money trying to make people’s lives better only to find themselves in massive debt, followed by massive political upheaval (as recently happened in Brazil). There is no single magical formula, yet the general principles laid out in this chapter do offer some valuable insight into what has occurred in the past 70 years. On average, human beings in the 21st century are healthier, living longer, earning more money, having fewer children, consuming more, and knowing more about their world than at any other time in the history of our species. Given these realities, there is reason for cautious optimism as we look forward to the next hundred years. Despite all of that, we must realize the fragility of our planet and the environmental cost that comes with the overconsumption of resources. As large countries like China become wealthier, hundreds of millions of new consumers create more plastic waste, more toxic runoff, more carbon emissions, more copper mines, and more demand for energy than ever before. The rush to development has often hastened ecological catastrophe, making it essential that future development efforts consider long-term sustainability as an anchor for decision-making in the 21st century and beyond.
9.8 KEY TERMS DEFINED
Absolute advantage – In economic terms, a country that is blessed with abundant natural resources or geographic advantages that are rare or in short supply and high demand elsewhere.
Adult literacy rate – The proportion of the adult population aged 15 years and over that is literate. This indicator provides a measure of the stock of literate persons within the adult population who are capable of using written words in daily life and continuing to learn.
Asian Dragons (Asian Tigers) – The high-growth economies of Hong Kong, Singapore, South Korea, and Taiwan: all of which focus on exports, an educated populace, and high savings rates as pathways to development.
BRICS countries – The countries of Brazil, Russia, India, China, and South Africa: countries that collectively account for 40% of the world’s population and 25% of the world’s land. From 1990 to 2014 these countries’ share of the global economy rose from 11% to almost 30%. In recent years, economic growth in the BRICS has been slowed by corruption, crisis, and dropping commodity prices.
Capitalism – The historically contingent economic system of trade in which parties are categorized into laborers and capitalists, both of whom seek to maximize their profit/wages. Within capitalism prices, production, and wages are determined by market conditions including, but not limited to, supply and demand. Contemporary capitalism is intimately tied to the Industrial Revolution and ensuing societal transformations in England that diffused across Europe initially and then to many other parts of the world. Capitalism assumes that rational consumers seek to maximize their utility.
Collectivism (collective societies) – A socio-political-economic system that prioritizes the well-being of the group over the individual. Collectivist modes of development, for example, tend to include progressive tax regimes, affordable access to healthcare and higher education for all, and protections for marginalized groups. In LDC this may also include communal ownership of land or other assets.
Comparative advantage – The principle whereby individuals (or territories) produce those goods or services for which they have the greatest cost or efficiency advantage over others and the lowest opportunity cost. The outcome tends to be specialization across places.
Dependency theory – A theory of development positing that the global economic system disadvantages certain regions and countries. It is argued that prior colonial relationships created systems of trade that benefitted the colonizer much more than the colonized. Countries that were made producers of pineapple, sugar, rubber, and other products during colonial times continued to be dependent upon the production of very low-profit items, limiting opportunities to produce other more valuable products and services long after independence because the trade systems remained the same.
Developing country – A term that includes all countries, other than those in the wealthiest category, that continue to improve their levels of development in the late 20th and early 21st centuries. The label has come to replace the less preferred term, LDC, to account for the fact that LDC is a static identifier, while “developing” is a dynamic one.
Development – Processes related to improving people’s lives through improved access to resources, technology, education, wealth, opportunity, and choice. Governments, individuals, non-profit organizations, and inter-government agencies all work towards similar goals with a variety of different approaches.
Domestic subsidy – A government-sponsored financial incentive that provides a production advantage to a company or entity. This may take a variety of forms. Examples include no-interest loans or cash payouts to farmers that meet certain criteria. Such programs are designed to lower risks and increase the productivity of particular industries, services, or products and to protect them from competition that comes from outside of that country.
Fair trade – One of a variety of different global trading systems that seek to guarantee fair (higher) payment for producers, often with other social and environmental considerations.
Free trade – A system of trade that removes (or attempts to remove) all “artificial” barriers that otherwise limit exports and exports between countries. A major component of free trade is the elimination of tariffs, duties, domestic subsidies, or laws that favor one country or company over another.
Formal economy
Gig economy – A labor market characterized by the prevalence of short-term contracts or freelance work as opposed to permanent jobs.
Gross domestic product (GDP) – All of the goods and services produced within a country within a given year. The formula for GDP is Consumption + Investment + Government Spending + Net Exports. The global GDP was approximately $76 trillion in 2016.
Gross national happiness (GNH) – A holistic and sustainable approach to development, which balances the material and non-material values with the conviction that humans want to search for happiness. The objective of GNH is to achieve a balanced development in all the facets of life that are essential for collective and individual happiness. The 4 pillars of happiness are 1) sustainable & equitable socio-economic development; 2) environmental conservation; 3) preservation & promotion of culture; and 4) good governance.
Gross national income (GNI) – All of the goods and services produced within a country in addition to all of the net income its companies and citizens receive from overseas.
GDP per capita – GDP divided by the total population.
Global North – Those countries generally considered to be “more developed,” which also fall primarily north of the Brandt Line as drawn in 1980. See Figure 9.1.
Global South – Those countries generally considered to be “less developed,” which also fall primarily south of the Brandt Line as drawn in 1980. See Figure 9.1.
Human agency – The concept that human beings take an active role in their situation to invoke change. The concept is of critical importance in understanding how and why models and theories of development are so complex.
Human Development Index (HDI) – A measure developed by the United Nations in 1990 to consider and compare levels of development by all countries of the world using life expectancy, literacy, school enrollment, and income as indicators. This provides a more meaningful way to compare countries than looking only at income/GDP. Those with the highest HDI tend to be in Australia and Northern Europe. Those with the lowest tend to be in Sub-Saharan Africa.
Human Development Report – An annual comprehensive analysis, assessment, and ranking of every country in the world based on the Human Development Index. The report has been compiled and released every year since 1990.
Import substitution model
Infant mortality rate – A measure of how many children die in any given year compared to 1,000 live births. Countries with low levels of development tend to have high infant mortality.
Informal economy – Those activities within any economic system that are unregulated, untaxed, and/or unquantified. Includes, but is not limited to, selling anything illegally, unreported paid work, and consuming unlicensed/artificial products (movies, music, watches, etc.). Women, children, and the poor are those most likely engaged in the informal economy, but globalization and technology also play an important role in driving new forms of informatization. This sector of the economy is also related to the rise of the gig economy, in which workers increasingly are contractors rather than employees – an important distinction.
International trade model of development – A strategy of development in which a country embraces free trade and elects to seek specialization of certain products and services that are valuable as exports in the global marketplace. Following such a strategy necessitates the embrace of increasing imports and removing trade barriers.
International Monetary Fund (IMF) – An intergovernmental organization that provides short-term loans to governments that are in economic crisis.
Least developed countries (LDCs) – Defined by the United Nations, those countries with the lowest levels of combined income, human assets, and economic vulnerability. In 2015, LDC criteria were given to 48 countries, where 950 million resided and more than half earned less than $1.25/day.
Life expectancy – The average predicted number of years of life for any given person beginning at birth. In 2015, global life expectancy was about 72 years.
Macroeconomic theory – The branch of economics concerned with large-scale or general economic factors, such as interest rates and national productivity.
Market liberalization – A process of removing barriers to foreign companies from operating and competing with domestic ones.
Modernization theory – Belief that, with the proper intervention, each country will pass through a similar pathway of development.
Micro-finance – Financial and banking services designed for those who otherwise would be excluded due to their socioeconomic situation.
Micro-loans – Very small loans designed for those who otherwise would be excluded due to their socioeconomic situation.
More developed countries (MDCs) – A category for those countries that have the highest levels of development as measured by income, education, and industrialization. MDCs tend to derive most of their GDP from services rather than from agriculture or manufacturing in the 21st century. The term MDC is used less commonly than the term “developed country” but serves as a convenient way to refer to the wealthiest countries collectively.
Newly industrialized country (NIC) – Examples include (but are not limited to) India, China, Singapore, Taiwan, Turkey, Brazil, Mexico, South Africa, and Thailand.
A nontariff barrier to trade – Any impediment to trade placed by governments, including regulations based upon environmental, cultural, or political concerns. Examples include political trade embargoes or the prohibition of trade in eagle feathers, “blood” diamonds, and human organs.
Opportunity cost – The activity that has to be given up (forgone) to conduct the current activity. A country, for example, may choose to specialize in the production of coffee or cocoa. If it chooses coffee, then the opportunity cost is represented by the cocoa production that it could have but did not produce. In classical economic terms, the opportunity cost is the difference between the two outcomes.
Per capita – Each person.
Protectionist model
Purchase Power Parity (PPP) – A formula that accounts for the cost of living variability from one place to another. PPP adjusted income allows for a meaningful comparison between two places with different cost structures.
Quota – A control on trade that limits amounts of particular items that may be imported or exported from/to a particular country.
Remittance – Money sent to the country of origin by overseas workers. This has become a significant driver of development in many countries in recent years.
Resource Curse/Dutch Disease – The idea that those places blessed with valuable natural resources often are negatively affected by the activities associated with cultivation, mining, and/or extracting those resources.
Self-sufficiency model of development – A centralized strategy of development for a country that seeks to develop all sectors of an economy within one’s own borders and reduce dependency on outside entities. Such an approach requires tight controls on imports and exports as well as considerable protection for domestic producers against outside competitors.
Specialization – A focus on skills, experience, and resources that improve the capacity to produce one or more types of goods or services that are in high demand in the global economy. Specialization is directly related to the international trade model of development.
Stages of Growth – A concept that aims to categorize any national economy according to its stage. Stages are deterministic. The 5 stages are traditional, transitional, takeoff, drive to maturity, and high mass consumption.
Structural adjustment program – A series of requirements (adjustments) placed upon any country that accepts a loan from the IMF.
Sustainable development – A mode of development theory and strategy that considers and accounts for the impacts of economic growth upon society, culture, and the environment.
Tariff – A tax placed upon imports.
Universalism – The idea that phenomena, conceptual definitions, or moral, aesthetic, or epistemological truths hold for all times and places, transcending their immediate local circumstances. Its significance for development lies in the belief that human development is not for the few, not even for the most, but for everyone.
World Bank – A financial institution established near the end of WWII to provide capital in the form of loans to developing countries and to those in need of reconstruction at the end of the war. The bank offers loans to countries for large-scale projects.
World systems theory – An approach to world history and social change that suggests there is a world economic system in which some countries benefit while others are exploited.
World Trade Organization (WTO) – An intergovernmental organization created in 1994 that promotes international trade between countries. It seeks to reduce trade restrictions, enforce existing agreements, and protect intellectual property.
9.9 WORKS CONSULTED AND FURTHER READING
Binns, Tony, et al. Geographies of Development: An Introduction to Development Studies, 3rd ed. Harlow: Pearson Education, 2008.
Bremmer, Ian. “The Mixed Fortunes in the BRICS Countries in 5 Facts.” Time Magazine Online, September 1, 2017. http://time.com/4923837/brics-summit-xiamenmixed-fortunes.
Budkin, Yanina. “Understanding Poverty.” World Bank, April 11, 2018. http://www. worldbank.org/en/topic/poverty/overview.
“Country Comparison of Real GDP (PPP).” In CIA World Factbook, 2017. https://www.cia. gov/library/publications/the-world-factbook/rankorder/2001rank.html.
Geary, Kate. “Learning Hard Lessons: AIIB and the Tarbela Dam in Pakistan.” The Wire, May 9, 2017. https://thewire.in/133795/learning-hard-lessons-aiib-tarbela-dampakistan.
Gregory, Derek, ed. The Dictionary of Human Geography, 5th ed. Malden, MA: Blackwell, 2009.
Good, Keith. “House Ag Committee Examines NAFTA – Trade Issues.” Farm Policy News, July 27, 2017. http://farmpolicynews.illinois.edu/2017/07/house-ag-committeeexamines-nafta-trade-issues
“Human Development Reports Table 2: Trends in the Human Development Index, 1990–2015.” United Nations Development Programme, accessed January 17, 2018, http://hdr.undp.org/en/composite/trends.
Kelly, Annie. “Gross National Happiness in Bhutan: The Big Idea from a Tiny State That Could Change the World.” The Guardian: US Edition, December 1, 2012. https://www.theguardian.com/world/2012/dec/01/bhutan-wealth-happiness-counts.
Kiev, C.W. “What Dutch Disease Is, and Why It’s Bad.” The Economist, November 5, 2014. https://www.economist.com/blogs/economist-explains/2014/11/economistexplains-2.
“LDCs in Facts and Figures.” United Nations, accessed December 1, 2017, http://unohrlls. org/about-ldcs/facts-and-figures-2.
Long, Heather. “Reality Check: U.S. Manufacturing Jobs at 1940s Levels.” CNN Money Online. U.S. Version, April 7, 2017. http://money.cnn.com/2017/04/07/news/ economy/us-manufacturing-jobs/index.html.
Lopez, Ditas and Karl M Yap. “Donald Trump Has Call Centers in the Philippines Worried.” Bloomberg News, March 9, 2017. https://www.bloomberg.com/ news/articles/2017-03-10/trump-risk-prompts-philippine-call-centers-to-seeklobbyist.
McMichael, Philip. Development and Social Change: A Global Perspective, 3rd ed. Thousand Oaks, CA: Pine Forge Press, 2005.
Neate, Rupert. “Richest 1% Own Half the World’s Wealth, Study Finds.” The Guardian (US Edition), November 14, 2017. https://www.theguardian.com/inequality/2017/ nov/14/worlds-richest-wealth-credit-suisse.
Peet, Robert, and Ellen Hartwick. Theories of Development: Contentions, Arguments, Alternatives, 2nd ed. New York: Guilford Press, 2009.
“Population Reference Bureau Data Finder.” United Nations Population Reference Bureau, accessed February 11, 2018. http://www.prb.org/DataFinder.
Reuters Staff. “Mexican Agency Finds Irregularities in Pemex, Odebrecht Contract.” Reuters Online, September 11, 2017. https://www.reuters.com/article/us-mexico-brazilcorruption/mexican-agency-finds-irregularities-in-pemex-odebrecht-contractidUSKCN1BN08D
Simoes, Alexander. “South Korea.” The Observatory of Economic Complexity. Accessed January 17, 2018. https://atlas.media.mit.edu/en/profile/country/kor/.
Stanton, Elizabeth. “The Human Development Index: A History.” Working Paper Series Number 127. Political Economy Research Institute. University of Massachusetts Amherst. February 2007. https://scholarworks.umass.edu/cgi/viewcontent. cgi?article=1101&context=peri_workingpapers.
Stephenson, Wesley. “Have 1,200 World Cup workers really died in Qatar?” BBC News Magazine, June 6, 2017. http://www.bbc.com/news/magazine-33019838.
Yueh, Linda. “Can De-industrialisation Be Reversed?” BBC News, February 16, 2015. http://www.bbc.com/news/business-31495851.
9.10 ENDNOTES
- https://blogs.worldbank.org/opendata/new-world-bank-country-classifications-income-level-2022-2023
- https://worldmapper.org/maps/gni-2018/?f_action=get_data&sf_data=results&_sft_product_cat=income
- https://worldpopulationreview.com/country-rankings/gnp-by-country
- https://www.prb.org/international/indicator/gross-national-income/table
Media Attributions
- Chapter 9 Moodle Image
- World income a
- World Income b
- Top 15 GNI countries
- Top 15 GNI countries PRB
- GDP Trend
- GDP Growth Rate
- HDI Trends
