Chapter 7: Ethnicity, Race, and Sexual Orientation
Chapter 7: Ethnicity, Race, and Sexual Orientation
David Dorrell
Very Well/Alex Dos Diaz: https://www.verywellmind.com/difference-between-race-and-ethnicity-5074205
STUDENT LEARNING OUTCOMES
By the end of this section, the student will be able to:
Discuss: the differing bases of ethnic identity, race, and sexual orientation
Explain: how personal identity and its relationship to race, ethnicity, and sexual orientation will change based on where one lives
Describe: the degrees of relevance of ethnicity, race, and sexual orientation in a society
Connect: ethnicity, race, sexual orientation, and class as they relate to current politics
CHAPTER OUTLINE
7.1 What are ethnicity and race?
7.1 WHAT ARE ETHNICITY AND RACE?
A common question asked in introductory geography classes is “What is ethnicity and how is it different than race?” The short answer to that question is that ethnicity involves learned behavior and race is defined by inherited characteristics. This answer is incomplete. In reality, both race and ethnicity are complex elements embedded in the societies that house them. The relationship between race, ethnicity, and economic class further complicates the answer.
Other students have asked, “How is this geography?” Ethnicity and race have strong spatial dimensions. Both races and ethnicities have associated places and spatial interactions. A person’s ability to navigate and use space is contingent upon many factors: wealth, gender, sexual orientation, and race/ethnicity. Anything that sets limits on a person’s movement is fair game for geographic study. Numerous geographic studies have centered on the sense of place. Race and ethnicity are part of a place. Signs are written in languages, houses have styles, people wear clothing (or not!), and all of these things can indicate ethnicity.
7.1.1 The Basis of Ethnicity
Ethnicity is identification through language, religion, collective history, national origin, or other cultural characteristics. A cultural characteristic or a set of characteristics is the constituent element of ethnicity. Another way of thinking of an ethnicity is as a nation or a people. In many parts of the world, ethnic differences are the basis of political or cultural uprisings. For example, in almost every way the Basque people residing on the western border between France and Spain are exactly like their non-Basque neighbors. They have similar jobs, eat similar foods, and have the same religion. The one thing that separates them from their neighbors is that they speak the Basque language. To an outsider, this may seem like a negligible detail, but it is not. It is the basis of Basque national identity, which has produced a political separatist movement. At times, this movement has resorted to violence in their struggle for independence. People have died over the relative importance of this language. The Basques see themselves as a nation, and they want a country.
The ethnicities of dominant groups are rarely ever problematized. Majority ethnicities are considered the default, or the normal, and the smaller groups are in some way or another marginal. Talking about ethnicity almost always means talking about minorities.
There are three prominent theories of Ethnic Geography: amalgamation, acculturation, and assimilation. These theories describe the relationship between majority and minority cultures within a society. Amalgamation is the idea that multiethnic societies will eventually become a combination of the cultural characteristics of their ethnic groups. The best-known manifestation of this idea is the notion of the United States as a “melting pot” of cultures, with distinctive additions from multiple sources.
Acculturation is the adoption of the cultural characteristics of one group by another. In some instances, majority cultures adopt minority cultural characteristics (for example, the celebration of Saint Patrick’s Day), but often acculturation is a process that shifts the culture of a minority toward that of the majority.
Assimilation is the reduction of minority cultural characteristics, sometimes to the point that the ethnicity ceases to exist. The Welsh in the United States have few, if any, distinct cultural traits.
When we looked at the previous chapters—Language, Religion, and now Ethnicity—we have explored subjects that are often the core of a person’s identity. Identity is who we are, and we, as people, are often protective of those who share our collective identity. For example, ethnicity and religion can be closely tied, and what can appear as a religious conflict may be a politicized ethnic disagreement or a struggle over resources between ethnicities that has become defined as a religious war. Muslim Fula herders and Christian farmers in Nigeria aren’t battling over religious doctrine; they’re two different peoples fighting for the same land and water resources.
One of the enduring ideas of modern political collectives is that we consider everyone within the boundaries of our country as “our group.” The reality has not lived up to that concept, however. Many modern countries are wracked by ethnic struggles that have proven remarkably resistant to ideas of ethnic or racial equality.
7.1.2 Race
The central question around race is simple: “Does race even exist?” Depending on how the question is framed, the answer can be either yes or no. If race is being used in a human context in the same way that species is used in an animal context, then race does not exist. Humans are just too similar as a population. If the question is rephrased as, “Are there some superficial differences between previously spatially isolated human groups?” then the answer is yes. There are genetic and heritable differences between groups of people. However, these differences in phenotype (appearance) say very little about genotype (genetics). Why is that? The reality is that human beings have been very mobile in their history. People move, and they mix with other groups of people. There are no hard genetic lines between different racial categories in the environment. As a consequence of this, racial categories can be considered socially constructed.
7.1.3 How are Ethnicity and Race Different?
People tend to have difficulties with the distinctions. Let’s start with the easiest racial category in the United States—African American. Most people understand that the origin of the African American or Black population of the United States is Africa. That is the race part. Now, the ethnic part appears to be the same thing, and it almost is, but only for a particular historical reason. If Africans had been forcibly migrated by group—for example, large numbers of BaKongo or Igbo people were taken from Africa and brought to Virginia and settled as a group—then we would be talking about these groups as specific ethnicities in the same way we talk about the Germans or Czechs in America. The Germans and Czechs came in large groups and often settled together and preserved their culture long enough to be recognized as separate ethnicities.
That settlement pattern did not happen with enslaved Africans. They were brought to the United States and sold off effectively at random, and their ethnic cultures did not survive the acculturation process. They did, however, hold on to some general group characteristics, and they also, as a group, developed their cultural characteristics here in the United States. Interestingly, as direct African immigration to the United States has increased, the complexity of the term African American has increased since it now includes an even larger cultural range.
7.1.4 Specifically Ethnic
The United States is a multiethnic and multiracial society. The country has recognized this from the very beginning, and the U.S. Census has been a record of ethnic representation for the U.S. since 1790. Here are the current racial categories (Figure 7.1)
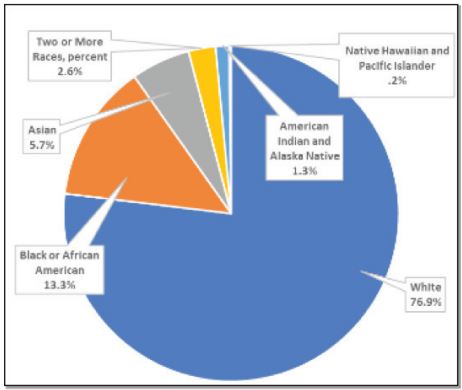
Figure 7.1 U.S. Racial Makeup according to the United States Census of 2016; Author | David Dorrell; Source | Original Work; License | CC BY SA 4.0.
There are many ethnicities in the United States, and data are collected to a granular level, but in many ways, the ethnic categories are subsets of the racial categories. The idea is that race is a large physical grouping, and ethnicity is a smaller, cultural grouping. Thinking about the data this way helps us understand why African American is both an ethnicity and a race (remembering that there are African Americans who come directly from Africa). Another more complete example is the numerous ethnicities among American Indians. Within the race category of American Indian and Alaska Native are dozens of individual nations (Figure 7.2).
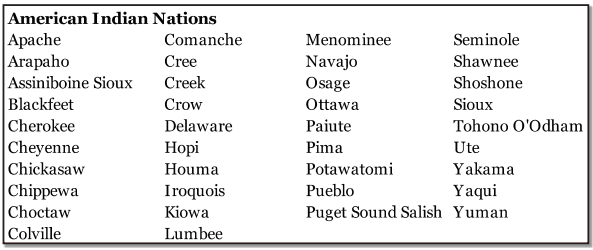
Figure 7.2 Federally Recognized American Indian Nations; Author | David Dorrell; Source | Original Work; License | CC BY SA 4.0.
Since 1976, the United States government has required the collection and analysis of data for only one ethnicity: “Americans of Spanish origin or descent.” The term used to designate this ethnicity is Hispanic. It is a reference to the Roman name for what is now modern Spain. Hispanics, however, are generally not Spanish; they are people who originate in one of the former colonies of Spain. Another term that is used is Latino, which is another reference to the Roman Empire. Both of these labels are very vague. Generally, people identify with the country of their ancestors (Mexico, Thailand), and not with a label generated by the Census Bureau for recordkeeping.
Hispanics can be of any race. It is important to note that all racial and ethnic information is self-reported. This means that the person who decides if you are African American, Hispanic, or any other category is you. One final detail is that native people of Hispanic countries, even if they do not speak Spanish, will often be considered Hispanic.
7.2 RELEVANCE OF RACE AND ETHNICITY IN THE UNITED STATES
The importance of race and ethnicity is variable both across space and across time. Historically, divisions in the United States along ethnic or racial lines have been the norm, but now these divisions based on race or ethnicity are not as prevalent as they have previously been. From the earliest days of the country and codified in the US Constitution, slavery created a profoundly divided society, particularly between the free, white population and the enslaved Black population. Free people of color provided a small degree of linkage between the groups.
These were not the only divisions in the US, however. The dominant group was people of English descent. In geographical terms, we refer to them as a charter group. The charter group does not refer to the first people to come to a place; they are people with the first effective settlement. This is an academic way of saying that they are the first group with political dominance. English settlers produced laws that furthered their interests. They promoted their language (English), religion (Protestant Christianity), and governance. Groups coming in later found themselves in a place where many of the cultural questions had already been answered. The pressure to assimilate in the United States applies to everyone. There can be political pressure; for example, during World War I, German Americans largely stopped speaking German. The pressure can be social; for example, young children at school can feel isolated when they cannot speak the majority language. Particularly, the pressure can be economic. Without conforming to general social (majority) norms, it can be difficult to navigate the employment market. A lack of English, unawareness of the norms of formal dress or behavior, or just the inability to recognize social cues can make life difficult for those who have not acculturated.
The charter group also changed. For example, the definitions of “whiteness” and “blackness” have not been historically constant. Consider the history of the United States. Initially, the U.S. population was made largely of Protestant British white people and African black people. Adding people from other places required that definitions be amended.
Would Catholic Italians be considered “white”? In the past, many Americans would have said no. For that matter, neither would the Irish (because of their Catholicism) or Jews (because they aren’t Christian), but over time, these groups were generally included in the white category. Whiteness broadened to include more people. It became less of an ethnic category and more of a racial category.
Definitions of blackness evolved as well. In the American South, there eventually arose a legal framework that defined blackness as having any African ancestry. It would be possible (and relatively common) to be phenotypically white and legally black. Historically, mixed-race Creole people in Louisiana did not consider themselves to be black or white; they were another category altogether.
People attempting to emigrate from Asia, particularly China, were subject to their own set of exclusionary laws, which severely limited their migration to the United States. As late as World War II, it was considered acceptable for the government to intern (imprison) American citizens of Japanese descent over questions of their racial origins and loyalty.
One of the current interesting ethnic questions in the United States is the status of Hispanic people in the existing racial categories. Since Hispanic is not itself a racial category, people within this ethnicity can choose what label they feel is most appropriate. It appears now that Hispanics are identifying themselves as white in the U.S. census. This has an impact on projections for the future U.S. population. If Hispanics identify as white, then the U.S. will remain majority white for quite some time. If they do not, the U.S. will have no racial majority in a few decades.
Although race and ethnicity in the U.S. were largely associated with state-mandated identification, restrictive laws, and onerous obligations, today both race and ethnicity are self-identified for the census. Whereas at one time being Irish could be enough to deny someone employment, now it is a slogan to place on your welcome mat and celebrate once a year in March.
7.2.1 Racial Identifiers
The language used to identify racial groups has changed as well. For example, in broad terms of ethnicity, people of Asian descent who were born in the United States are now referred to as Asian Americans, although the census racial category is still Asian. The term Asian implies a relationship with Asia and no relationship with America. Asian Americans explicitly tie this group to America.
People who trace their ancestry to Africa have a different problem. This problem is a function of American history. The first census label for this group was simply Black. Over time other labels were used, such as Negro (which means black), and eventually, the term African American was adopted. This term is meant to provide a relationship between a population of people and a place of origin. In other words, it explicitly ties a group to its ancestral origin.
Although Native American is used in common speech in the U.S., the Census category is still American Indian, which is not the same as Indian-American (peoples associated with South Asia). The continued use of American Indian is somewhat outside the trend toward more descriptive categories.
7.2.2 Racism in the United States
Although racism and ethnic discrimination are similar, they are not the same thing. Although ethnic markers (generally) diminish over time, physical differences do not.
Exclusionary racial policies existed in the United States from the very beginning and have continued beyond the Jim Crow era of the twentieth century. From the US Constitution that counted slaves as 3/5 of a person to restrictive housing covenants in the lg6os, the country has had a history of racism that did not end in the Civil Rights era. This exclusion has not solely been limited to African Americans. Many groups have been subject to racist laws and acts. The indigenous people of the United States were not fully considered citizens until 1g24. In the past, voting rights, access to housing, and even union membership had racialized politics directed at many marginalized groups.
This is not to say that ethnically-based discrimination does not exist. Such discrimination has been prevalent in United States history, but it tends to subside as the host population absorbs the immigrant population.
7.2.3 Housing
Historically, ethnic groups tended to live near one another in spatially contiguous areas. Many cities have Chinatown or Little Italy. These are known as ethnic enclaves. There are many reasons why groups cluster; some reasons are voluntary and some are not. In the United States, it was not uncommon for cities to restrict where African American citizens could live. These restrictions were either through the force of law or through unwritten behavioral norms that resisted renting or selling houses to African American families outside of certain areas. This residential, spatial segregation was accompanied by educational, social, and economic segregation. African American communities were often known as ghettos, places where a certain population is forced to live. The word ghetto is older than the United States itself. Ghetto was an Italian name for the area that Jews were forced to live in. Although the word is Italian, the idea of forcing minority populations to live in designated areas has unfortunately had wide historical appeal. Legal housing segregation ended in the United States in iQ68, but behaviors change more slowly than laws.
Many ethnic communities have arisen from less coercive means. There are numerous reasons that an ethnic community would choose to live close together. Mutual support networks, the ability to develop schools and businesses catering to their own needs, a sense of safety, and the ability to retain their cultural connections are examples of positive reasons. Institutionalized poverty, marginalized political representation, and active discrimination are negative reasons.
7.2.5 Environmental Justice
One of the spatial manifestations of racism and ethnic discrimination is the difference in levels of political representation. Another one is the location of unpleasant environmental activities. Landfills and airports tend to be built in places inhabited by less-powerful groups, while dominant groups rarely, if ever, have to organize to prevent such things from being built in their neighborhoods. Some groups find their economic situations limited by underfunded schools or inadequate infrastructure. The idea that different groups should have access to decent places to live is called environmental justice.
7.2.6 Ethnic Diversity in the United States
Like all predominantly immigrant countries, the United States is ethnically diverse, but the range of ethnicities has varied over time as new groups arrive and previous groups acculturate and eventually assimilate. A male of Italian descent in the United States will sometimes just say, “I’m Italian.” This may be a person who speaks no Italian, isn’t Catholic, and has never been in Italy in his entire life. What, then, does this statement mean? It just signals a historic connection with an ethnicity, even if the connection has faded over time. This isn’t to single out Italian-Americans. Generally, as groups assimilate, their distinctive ethnic markers fade. Comparing Polish-Americans with Mexican-Americans may involve people who speak the same language (English), have the same Catholic religion, and live very similar lifestyles. The label has faded to a marker, with food being one of the last cultural elements.
7.2.7 Foodways
One of the ways groups demonstrate ethnicity is through food. One of the most obvious hallmarks of the arrival of ethnicity into the United States, or any other country, is the diffusion of food from the group of origin. Pizza in the United States, curry in the United Kingdom, and doner kebab in Germany all exemplify the degree to which a food brought by immigrants can reach the status of adopted national cuisine. Food is also the cultural element that is most accessible to outsiders. Foodways are used to construct a spatial sense of one location as a reflection of the entire world.
Foodways refer to the types of food that people eat, the ways they are prepared, and the cultural factors that surround and contextualize the food. Food is the most resilient cultural artifact. In countries undergoing language unification, foods can define ethnic groups. In mostly monolingual countries like the United States, foods may indicate geographical origins or social class. Food is easily bought, tried, accepted, or rejected. As such, it is the most accessible cultural element.
In many ways, the consumption of food and its production has been divorced from its roots by the modern restaurant industry and international food conglomerates. Americans have eaten foods they consider Chinese or Mexican for generations, while few know the histories of said foods. Questions of whether or not a food is authentic are difficult to answer when the cooks in a restaurant are of a completely different ethnicity from the stated cuisine.
We can compare foodways between places and groups. Quantities of food, the ratio of prepared foods, and consumption of tobacco and alcohol all help us get inside the lives of people in different places, at different stages of technological development, and in different socioeconomic classes.
7.2.8 The Ethnic Landscape
Urban ethnic landscapes are often immediately recognizable. Signs in other languages advertising exotic products, ethnic architecture, and even local tourism reveal the ethnic fabric of a place. Most people in the US do not live in large cities with obvious ethnic architecture. The majority of Americans, including many ethnicities, live in the suburbs and smaller towns. Instead of obvious population clusters, ethnic populations here can be widely dispersed. Instead of living within walking distance of their local store or religious structure, people will simply drive to such a place. Ethnicity has sprawled along with the rest of America. Waves of migration to U.S. cities and suburbs have created landscapes of tremendous ethnic difference embedded in architectural homogeneity.
7.2.9 Ethnic Festivals and the Idealized Homeland
One of the ways that ethnicities represent themselves is through festivals. People wear traditional clothing, play music from the old country, eat food previously reserved for holidays, dance the old dances, and promote their culture to others. Festivals are a way of reproducing a sense of home in emigrant communities. They are also a way of keeping children participating in activities they would otherwise forget.
Places represented in ethnic festivals in the United States are often not representative of those places now. Traditional Czech clothing at a Kolache Festival in Oklahoma represents a place/time that no longer exists, except perhaps to market “Czech-ness” to tourists.
7.3 ETHNICITIES IN THE UNITED STATES
The distribution of ethnicities in the United States follows patterns that have been in place for some time. Historic migrations (some of which were forced) produced the patterns we still see in the United States.
7.3.1 African Americans in the United States
African Americans in the United States are still heavily southern. Their distribution (Figure 7.3) dates to the beginning of the United States and the forced importation of millions of Africans. Starting in the early twentieth century, many African Americans migrated out of this region, but most did not. In the last decades of the twentieth century and the beginning of the twenty-first, there has even been a reverse migration of African Americans back to southern cities and suburbs.
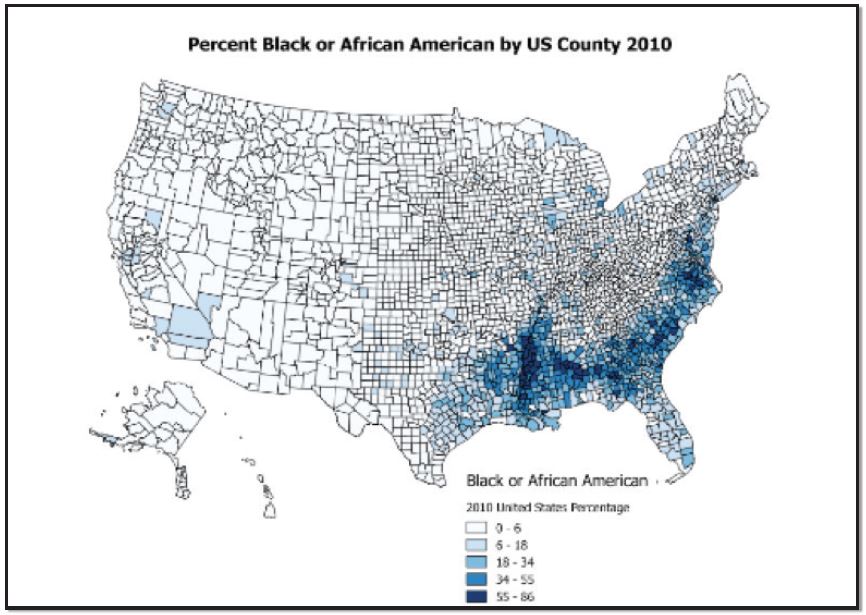
Figure 7.3 | The Distribution of the African American Population | Author | David Dorrell Source | Original Work License | CC BY SA 4.0
7.3.2 Hispanics in the United States
Many of the states with large Hispanic populations were states taken from Mexico by the United States in the Mexican-American War. In some ways, these places didn’t come to the United States; the United States came to them. Certainly, a pattern is apparent. Generally, the parts of the U.S. closest to Mexico or the Caribbean are the most Hispanic (Figure 7.4). There are other areas with high Hispanic populations. These places have been attractive to immigrants for their employment prospects.
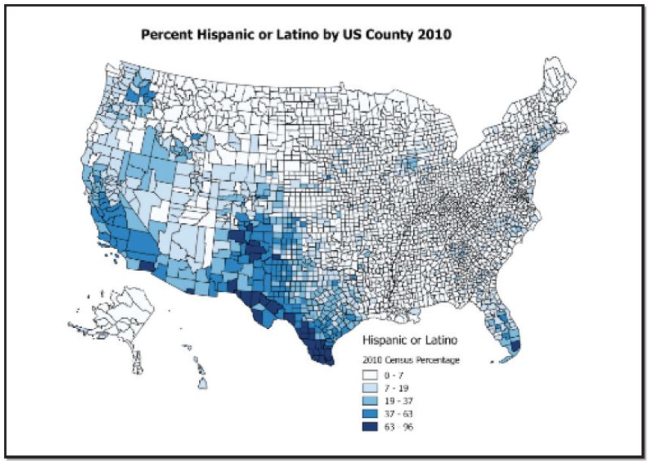
Figure 7.4 The Distribution of the Hispanic Population; Author | David Dorrell; Source | Original Work; License | CC BY SA 4.0.
7.3.3 Asian Americans in the United States
Asian Americans also have a distinctive distribution based on history. The western United States and, in particular, Hawaii are physically the parts of the United States that are closest to Asia. A proximity effect similar to that of Hispanics is in play here. Figure 7.5 shows their distribution.
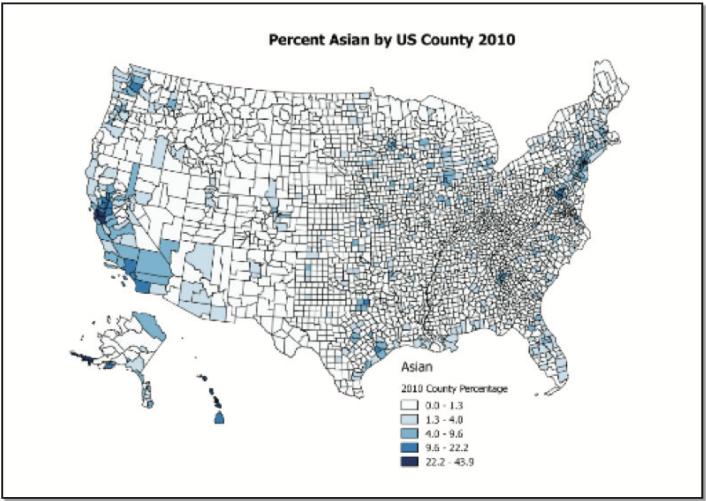
Figure 7.5 The Distribution of the Asian American Population; Author I David Dorrell; Source I Original Work; License | CC BY SA 4.0.
7.3.4 American Indian and Alaska Natives
Some live on reservations, but most do not (Figure 7.6).
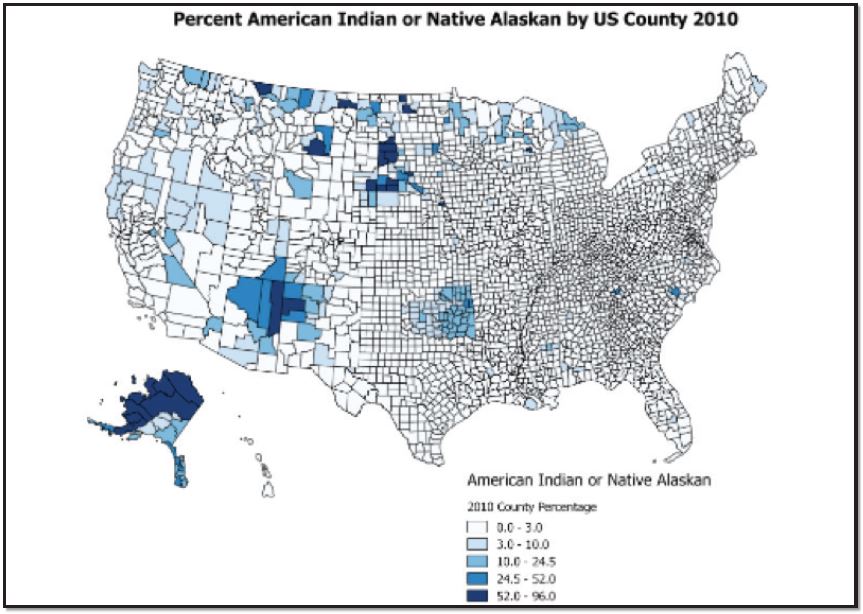
Figure 7.6 | The Distribution of the American Indian Population | Author | David Dorrell Source | Original Work License | CC BY SA 4.0
7.3.5 Native Hawaiian and Other Pacific Islanders
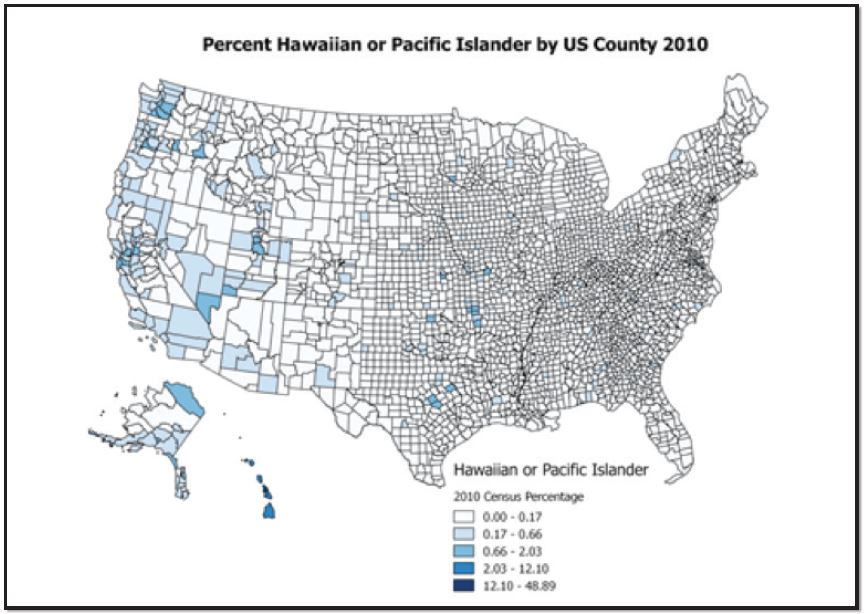
Figure 7.7 | The Distribution of the Native Hawaiian or Pacific Islander Population | Author | David Dorrell Source | Original Work License | CC BY SA 4.0
7.4 RELEVANCE OF RACE AND ETHNICITY IN OTHER PLACES
Although the social implications of race or ethnicity in the United States have eroded over time, this does not mean that that is no longer relevant. It also does not mean that ethnicity is not relevant anywhere else. In many places, it is still very important. In much the same way as race defined the early United States, it defined South Africa, Brazil, and other settler colonies. There were important differences between these places. Whereas white people who made up the racial majority ruled the United States, South Africa was ruled by a white racial minority. To preserve power for themselves, South African whites developed a system known as apartheid, which divided the population into several legally defined categories. Similar to the U.S. development of Indian reservations, the South African state also developed ethnically-based “Homelands” which were used as a means of denying citizenship to black South Africans.
Sustaining such a system required the use of a police state that eventually became unsustainable. In 1994, full and open elections were held, and the black majority gained political power. The state policy of separating people ended, but this did not immediately transform South Africa into a new kind of state. It has continued to negotiate the relationship between the outside world and internal political and economic struggles between differing factions in the country.
Brazilian society was far more racially mixed from the beginning. This simply changed the social equation from a binary black/white relationship to a society stratified by skin tone and migration status. As was the case in many colonies, people born in the colonizing state (in this case, Portugal) continued to enjoy elevated social standing well after the colonial era ended. In the same manner as the United States and South Africa, social standing was related to being part of the charter group.
In other places, purely ethnic differences have had violent consequences. In the i9gos in Rwanda and in Yugoslavia, ethnic tensions flared into open warfare and genocidal massacres. A new term was coined—ethnic cleansing—which denoted an attempt to completely expunge traces of another population from a place. In both of these places, it would have been difficult for an outsider, and sometimes even a local, to tell the differences between the two groups. Remember that ethnic differences can be based on historical groups that may now be very similar.
It should be noted that the massacre of opposing ethnicities and the appropriation of their territories was not a product of the twentieth century. The colonial phase of world history was largely defined by the massacre and marginalization of indigenous people around the world by people of European descent.
7.4.1 Ethnicities and Nationalities
Some countries have only one ethnicity and are called nation-states (remember that an ethnicity can also be called a nation). Most places are not like this and contain many ethnicities. Some ethnicities are minorities solely by a political boundary. Many groups have found themselves on the wrong side of an imaginary line. Sometimes this is due to outside forces imposing a boundary—for example, the Hausa in Nigeria and Niger—but sometimes it is a product of state creation itself. When the state of Germany was created, there were pockets of ethnic Germans scattered all over Europe. It would have been impossible to incorporate them all since they were spatially discontinuous.
In the former Union of Soviet Socialist Republics (USSR), attempts were made to make political boundaries match ethnic boundaries. Kazakh people had the Kazakh SSR, Uzbek people had the Uzbek SSR, and so forth. It was an idea based on ease of administration, but it wasn’t based on the actual distribution of the ethnic groups. The distributions were far too messy to draw clear, neat lines between them. This didn’t matter as long as the USSR was still functioning, but when it collapsed, it created another landscape of minorities on the wrong side of a boundary. Irredentism is when your ethnic group has people on the wrong side of a boundary, and it’s necessarily destabilizing. The following chapter on political geography will go into greater detail regarding this, but suffice it to say that split nations do not like being split.
Some ethnicities are numerous but find themselves minorities in several countries. Kurds, Balochs (Figure 7.8), and Sami are all nations that are distributed across several countries. Such groups often harbor strong desires to create their independent political entities to the detriment of currently existing states.
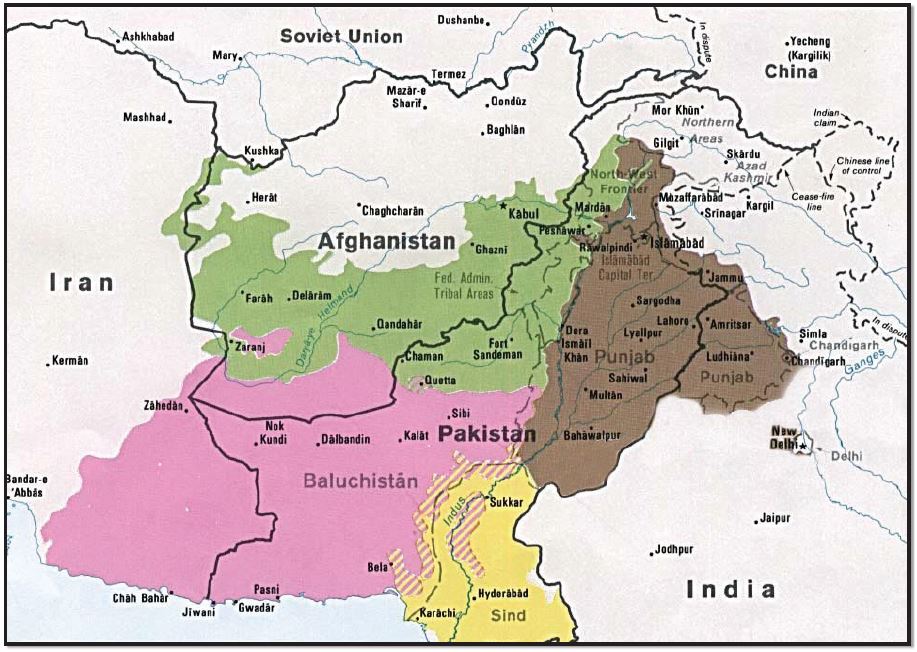
Figure 7.8 Pakistan Major Ethnic Groups, 1980; Author | U.S. Central Intelligence Agency; Source l Wikimedia Commons; License | Public Domain. This map details the politically fragmented spatiality of the Baloch people, separated into Iran, Pakistan, and Afghanistan.
As places unify politically and develop industrially, ethnicity often declines. Moving populations into cities and stirring them around in schools, militaries, and jobs fosters intermarriage and acculturation to the larger, national norms. Rural places tend to be more diverse, and somewhere like Papua New Guinea is probably the most diverse, because smaller villages still predominate. Somewhere like South Korea, which was already relatively ethnically homogenous, has become almost fully so due to economic development.
7.4.2 Is Diversity Good?
Diversity in developed countries is often promoted as a self-evident benefit, but there are some downsides to increasing diversity. Studies have shown that ethnic diversity decreases political participation. This is likely due not only to factors such as difficulties in communication but also simple mistrust of other groups of people, known as xenophobia. This mistrust can apply to all parties in the relationship. There are places in the world with very low levels of diversity. South Korea, Japan, and Finland are all highly productive economies with very little cultural or ethnic variability and high levels of social cohesion.
There are benefits to diversity. Aside from the benefits of genetic diversity (a reduction in recessive-gene disorders) ethnic diversity opens citizens to a wider range of experiences. Without pizza, sushi, tacos, stir-fry, or hamburgers, the United States would be a cultural wasteland forced to subsist on our British inheritance of boiled lunch and steak and kidney pie. Diversity has made our lives more pleasant, and it has made our ability to relate to others broader.
7.4.3 Immigration and Ethnicity
The United States is not the only place to receive immigrants or have ethnic diversity. Many places have far more ethnic diversity, even places that have little history of immigration. India, China, and Russia are all countries that have had diverse populations speaking different languages and living different lifestyles for a very long time.
In many ways, the impact of immigration on the ethnic fabric in Europe is the same as it has been in the United States. Due to the relative strength of their economies, European countries have been receiving large numbers of immigrants for some time. These immigrants are usually culturally distinct from the host population. In many instances, the immigrants come from places that had previously been colonies of European powers. The increase in immigrants with backgrounds dissimilar to the host country has triggered a rise in nationalistic or xenophobic activities and, in some places, a rise in political parties dedicated to reducing immigration or even repatriating current immigrants. The separate category of guest workers has created an even more complicated ethnic relationship. Guest workers are temporary workers who are contracted for a set period of time with the understanding that they will leave when the period of work has ended. By and large, that is not what happens due to the economic realities of short-term employment. People are reluctant to return to poverty.
7.4.4 Models of Ethnicity
Different places have different conceptions of ethnicity. In the United States, we separate race from ethnicity, and we have exhaustive lists of ethnicities collected by the census. France collects neither racial nor ethnic data, under the belief that every French citizen is ethnically French. This doesn’t include linguistic minorities such as the Bretons, the Basques, or the Alsatians, all of whom are indigenous to France and whose ideas about their ethnicities are different from those of the state.
In other places, ethnic identity is the most significant impediment to state cohesion. In Nigeria, no less a person than Nobel Prize winner Wole Soyinka wrote, “There is no such thing as a Nigerian.” He wasn’t saying that Nigerians are a figment of the imagination. He was stating that in his country, few people would identify first as a Nigerian, but instead as Igbo, Yoruba, Hausa, or many others. This is another concept that will be addressed in the next chapter.
7.5 SEXUAL ORIENTATION
7.5.1 The Basis of Sexual Orientation
The topic of sexuality and sexual orientation could easily comprise an entire course, so this section intends to simply introduce the topic and provide additional geographical resources to explore deeper concepts in other courses. In essence, we begin forming sexual attractions and the beginnings of our sexual identity around puberty. The most basic terms that we are likely familiar with regarding these identities include heterosexuality and homosexuality.
Famous psychologists like Alfred Kinsey conducted thousands of interviews to research the topic and many of the baseline findings are still significant today. Sexual Behavior in the Human Male (1948) and Sexual Behavior of the Human Female (1953) are known collectively as the Kinsey Reports. Together, they sold nearly a million copies and were translated into 13 languages. The Kinsey Reports are associated with a change in public perception of sexuality and are considered part of the most successful and influential scientific books of the 20th century. (https://kinseyinstitute.org/)
In the 1950s and 1960s, many therapists offered aversion therapy of the kind featured in A Clockwork Orange to “cure” male homosexuality. This typically involved showing patients pictures of naked men while giving them electric shocks or drugs to make them vomit and, once they could no longer bear it, showing them pictures of naked women or sending them out on a “date” with a young nurse. Needless to say, these cruel and degrading methods proved entirely ineffective.
First published in 1968, DSM-II (the second edition of the American classification of mental disorders and a forerunner of DSM-5) still listed homosexuality as a mental disorder. In this, the DSM followed in a long tradition in medicine and psychiatry, which in the nineteenth century appropriated homosexuality from the Church and, in what must have seemed like an élan of enlightenment, promoted it from sin to mental disorder.
In 1973, the American Psychiatric Association (APA) asked all members attending its convention to vote on whether they believed homosexuality to be a mental disorder. 5,854 psychiatrists voted to remove homosexuality from the DSM, and 3,810 to retain it.
The APA then compromised, removing homosexuality from the DSM but replacing it, in effect, with “sexual orientation disturbance” for people “in conflict with” their sexual orientation. Not until 1987 did homosexuality completely fall out of the DSM. (https://www.psychologytoday.com/)
Aside from aversion therapy, across the country, we have seen numerous “Gay Conversion Camps.” As recently as 2017, ABC News investigated a so-called Christian camp in Alabama. See the video footage here:
https://abcnews.go.com/GMA/video/undercover-called-gay-conversion-camp-46038064
Regarding the homosexual community, further identification of subgroups within the community became necessary to understand the uniqueness of each. In particular, a common acronym became largely popular, “LGBT”—which stands for lesbian, gay, bisexual, and transgendered. As time progressed, the acronym expanded to LGBTQIA+. (https://gaycenter.org/community/lgbtq).
Using data from the 2020–2021 Behavioral Risk Factor Surveillance System (BRFSS), a recent study estimates the percentage and number of LGBT adults at the national, state, and regional levels. Combining 2020–2021 BRFSS data, the study estimates that 5.5% of U.S. adults identify as LGBT, or almost 13.9 million (13,942,200) LGBT adults in the U.S. (https://williamsinstitute.law.ucla.edu/publications/adult-lgbt-pop-us/). See Figure 7.9 for the adult LGBT population distribution in the United States.
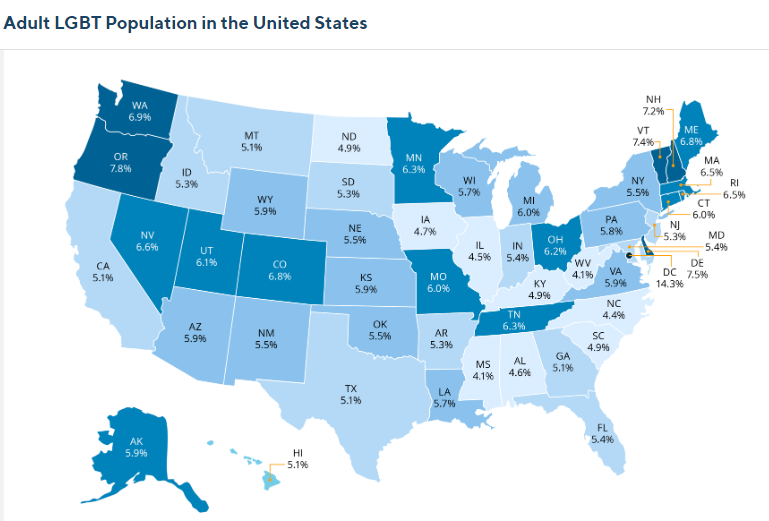
Figure 7.9 The Distribution of the Adult LGBT Population8; Author | The Williams Institute; Source | Behavioral Risk Factor Surveillance System (BRFSS); License | Public Domain.
It is important to note that a person’s sexual orientation is not a choice; it is a natural instinctive attraction that should be explored and valued. Self-shame is often a component for young gay males in American society as they are commonly stigmatized as being too feminine or weak, as compared to their heterosexual male counterparts. Similarly, lesbian and transgendered youth face isolation, shame, and even homelessness when they share their sexual orientation with family and friends. Suicide is the second leading cause of death among young people aged 10-24 (Hedegaard, Curtin, & Warner, 2018), and lesbian, gay, bisexual, transgender, queer, and questioning (LGBTQ+) youth are at significantly increased risk. The Trevor Project estimates that more than 1.8 million LGBTQ+ young people (ages 13-24) seriously consider suicide each year in the U.S.—and at least one attempts suicide every 45 seconds (https://www.thetrevorproject.org/resources/article/facts-about-lgbtq-youth-suicide/).
See Figure 7.10 for LGBTQ Youth Suicide Risk in the United States.
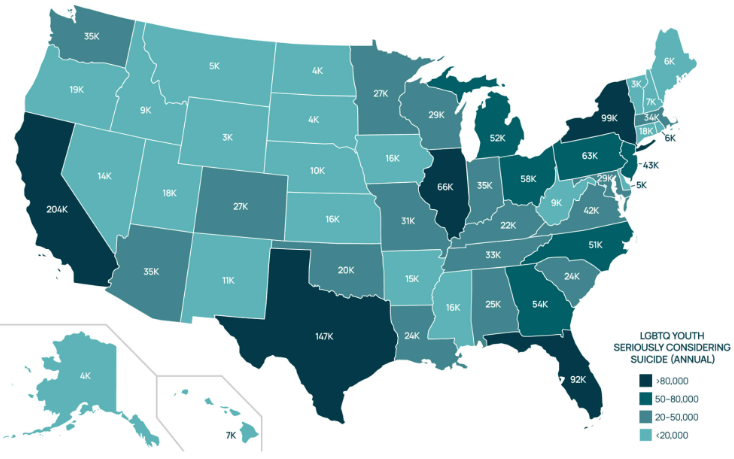
Figure 7.10 LGBTQ Youth Suicide Risk9; Author | The Trevor Project; Source | Centers for Disease Control and Prevention (CDC); License | Public Domain.
In 2022, some states passed laws that prevent public school educators from saying the word “gay” in classrooms or discussing anything that relates to gender identity or sexual orientation. First applied to kindergarten through 3rd grade, an amendment document now extends this ban to include 4th through 12th grade also.
7.5.2 The History of LGBT in the United States’ Military
It was not until 1982 that the military enacted a policy explicitly banning gay men and lesbians from their ranks. Before that, however, same-sex relations were criminalized and cause for discharge. In the early 1940s, it was classified as a mental illness, disqualifying gay men and lesbians from service.
In 1993, the “Don’t ask; Don’t tell” policy went into effect, allowing closeted LGBT people to serve in the military. Under the policy, service members would not be asked about their sexual orientation but would be discharged for disclosing it. Eighteen years later, Congress repealed the policy, allowing openly gay, lesbian, and bisexual people to serve in the military.
Another barrier was lifted in 2013 when spousal and family benefits were extended to same-sex married partners in the military. After ending temporarily in 2016, the ban on transgender individuals was again rescinded in 2021, allowing those who don’t identify with their biological gender to enlist and serve in the armed forces (https://www.militaryonesource.mil/relationships/support-community/lgbtq-in-the-military/).
7.5.3 Hate Crimes
On October 6, 1998, Matthew Shepard, an openly gay University of Wyoming freshman, had just met up with friends to plan LGBT awareness week on the town’s campus. But he couldn’t persuade them to join him for a beer afterward. At the Fireside Lounge, the 21-year-old somehow ended up chatting to two roofing workers, Russell Henderson and Aaron McKinney, both the same age as him.
The pair saw an easy mark in the 5 ft 2 in, slightly built student. Albany County Sheriff Dave O’Malley, who was the lead investigator in the case, says: “McKinney’s statement said he and Russell went into the bathroom at the Fireside bar and they planned to act like they were gay to try to gain Matthew’s confidence.”
“And so, the sexual orientation issue started right at the beginning of that contact.” The killers would tell police they planned to lure Shepard into McKinney’s pick-up truck so they could rob him. This is an important factor in establishing that this was indeed a hate crime.
Once in the vehicle, McKinney pulled a gun, beat Shepard, and seized his wallet, which contained $20. They drove about a mile out of town down a dirt path that ended in a rocky prairie of sagebrush and range grass. Henderson used a clothesline to tie Shepard to a log fence. McKinney began to ferociously pistol-whip their captive. Sheriff O’Malley says the student was “struck in the head and face between 19 and 21 times with the butt of a very large Smith and Wesson revolver.”
“The only time I’ve ever seen those dramatic of injuries were in high-speed traffic crashes, you know, where there were just extremely violent compression fractures to the skull.” McKinney and Henderson stole their victim’s patent leather shoes and left him to die.
He would remain tied to the log fence for 18 hours in the frigid Wyoming cold. The following evening a teenager fell off his mountain bike and noticed nearby what he thought was a fallen scarecrow or Halloween costume. He realized it was a person. Policewoman Reggie Fluty responded to the scene.
Standing at the spot now, the former patrol officer recalls: “Matt was on his back with his arms behind him. His respirations were far and few between. And I thought he was way younger than what he was just because his stature was so small.”
Matthew died five days after the attack, with his parents at his side (https://www.bbc.com/news/world-us-canada-45968606).
7.5.4 LGBT Hate Crime Timeline
The list of well-publicized murders of gay, lesbian, bisexual, and transgender people now includes victims of the worst mass shooting in U.S. history, which saw 49 people gunned down in June of 2016 at a gay nightclub (Pulse) in Orlando, Florida. Below are just a few examples of historic attacks in bold and by date.
For a more detailed and inclusive list of LGBT hate crimes, please read this article from National Geographic: https://www.nationalgeographic.com/history/article/orlando-nightclub-shooting-lgbt-gay-hate-crimes-history/.
More than 20 percent of U.S. hate crimes in 2014 (the most recent year available) targeted people because of sexual orientation or gender, according to FBI statistics cited by the activist group Human Rights Campaign. And while countless people have been the victims of individual attacks, large groups at nightclubs and other settings worldwide have also been subject to violence.
June 28, 1969 – Police, in the early morning hours, raided a gay bar, the Stonewall Inn, located in the Greenwich Village neighborhood of Manhattan, New York City. This event sparked the Stonewall riots, which were a series of demonstrations by members of the LGBT community.
June 24, 1973 – An arsonist burned the Upstairs Lounge, a gay bar in New Orleans, killing 32 people.
June 12, 2016 – 29-year-old Omar Mateen shot and killed 49 people and wounded 53 more in a mass shooting at Pulse, a gay nightclub in Orlando, Florida.
See Figure 7.11 – for hate crimes in the United States.
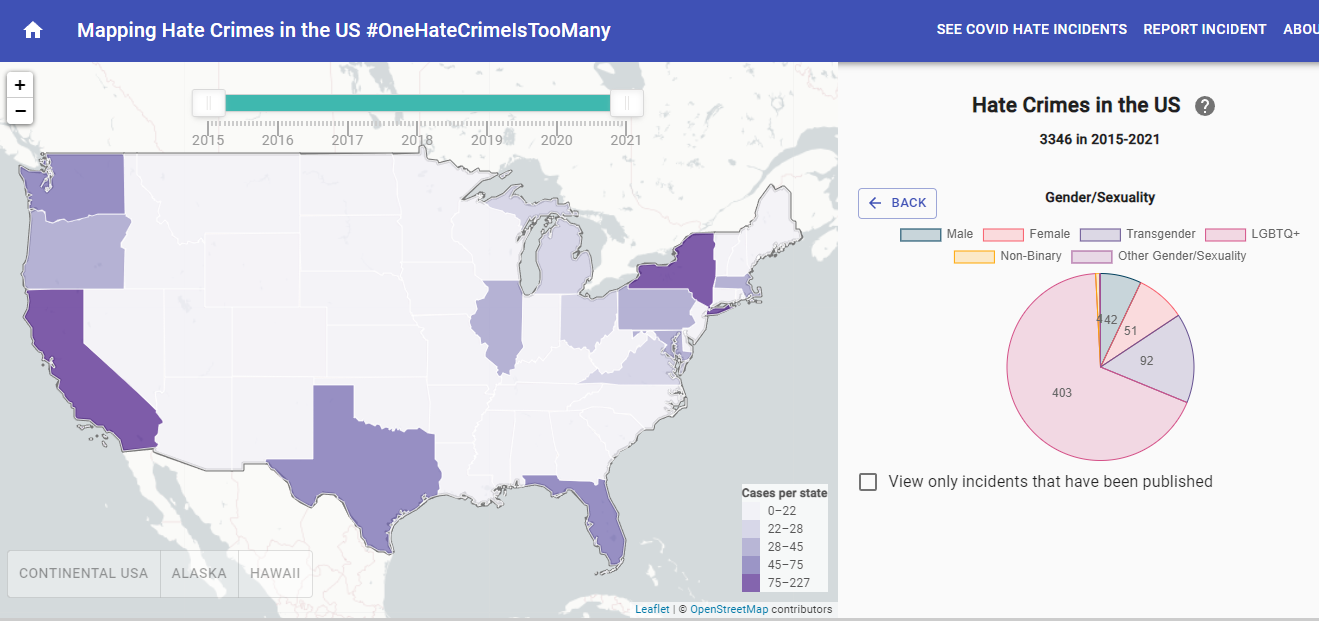
Figure 7.11 Hate Crimes in the United States10; Author | Hate Crimes Map, and Leaflet, and OpenStreetMap; Source | ProPublica’s Documenting Hate project and the Stop AAPI Hate Reporting Center; License | Public Domain.
7.5.5 Nature Versus Nurture
There are differences of opinion on whether being “straight” (heterosexual) or gay (homosexual) is based on nature/biological factors versus nurture/how a person is raised and what experiences and influences they were exposed to during development. Some scientists and psychologists even argue that it is a combination of both.
Regardless of either, it is important to note that being heterosexual or homosexual is not a choice. The actions of sexual relations certainly are, but being attracted to the opposite sex or same-sex individuals is not. The attraction component is a part of the individual, just like skin color or height. The individual does not choose these; they are simply a part of who they are and cannot be changed.
To learn more about nature versus nurture, please utilize the resource links below.
https://www.simplypsychology.org/naturevsnurture.html
https://www.rtor.org/2022/12/08/nature-versus-nurture-in-gender-and-sexuality/
https://youtu.be/tp0BQPfNklA?si=LkJQQxF2FreU9rLE
7.5.6 Same-Sex Marriage and LGBT Politics
Same-sex marriage is now legal in more than 30 countries and territories around the world, according to a new Pew Research Center analysis. In 24 of these places where detailed statistics are available, same-sex marriages in recent years have ranged from less than 1% to 3.4% of all marriages.
The Census Bureau estimates that as of 2021, 711,129 of the nation’s 61.3 million married-couple households, or 1.2%, involved same-sex married couples. As in many other countries, households with two married women were more prevalent than households with two married men in the U.S., accounting for 52.6% of all same-sex married-couple households (https://www.pewresearch.org).
See Figure 7.12 for US States that have unenforceable constitutional amendments and/or statutes banning same-sex marriages.
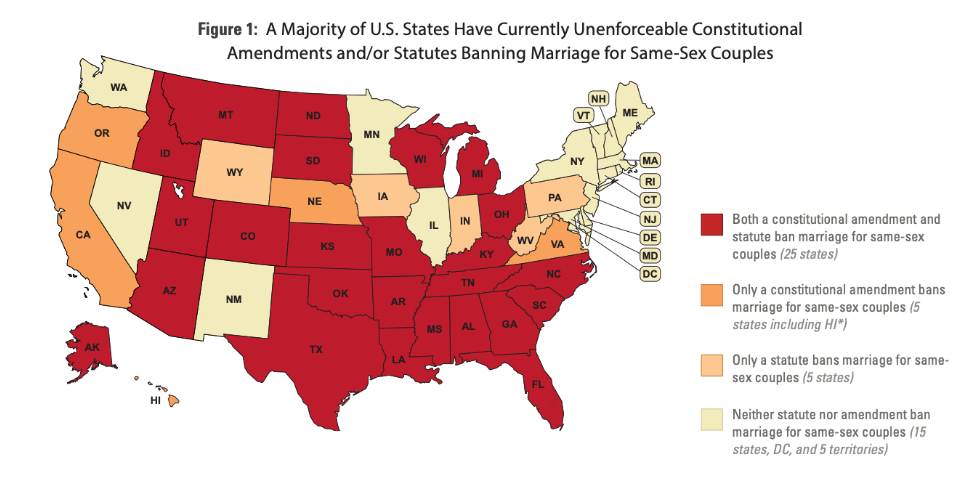
Figure 7.12 Same-Sex Marriage Map11; Author | Movement Advancement Project; Source | Movement Advancement Project; License | Public Domain.
The implications of the existing marriage laws on the books are varied, and eliminating those existing bans is challenging. The process for amending state constitutions is arduous and requires not only legislative action but also approval from voters. And many of the states that still have statutory bans on the books are places where efforts to pass nondiscrimination protections for LGBTQ have faced substantial barriers
While many steps would need to happen for these bans to be enforceable again, their existence continues to signal the extent to which marriage equality remains a politicized issue (https://www.lgbtmap.org/news/Marriage-Report-March-2022). For that and many other issues regarding the LGBT community, the Human Rights Campaign was formed in 1980 by Steve Endean.
The Human Rights Campaign organization was primarily a fund for supporting pro-fairness congressional candidates. In the early days of HRC, there were few openly LGBTQ+ officials in office.
In 1995, HRC rebranded the organization to reflect their expanded programs, research, and communications by dropping “fund” from their name and launching a new logo. The iconic blue-and-yellow equal sign has become synonymous with the fight for equal rights for LGBTQ+ people. HRC began a long period of robust growth and became respected as one of the largest and most effective mainstream advocacy organizations in the country.
With an estimated 52 million Equality Voters across America, the HRC community is one of the largest and most politically engaged voting blocs in the country (https://www.hrc.org/about).
7.6 SUMMARY
Ethnicity is key to our identity. It can be formed around a variety of nuclei—historical ties, national origin, language, religion, or any admixture thereof. Ethnicity creates a feeling of belonging to a group. Ethnicity, of course, can also be a source of exclusion to those who do not belong to the group that holds power in a place. Discrimination and prejudice often have a root in ethnicity, although other factors, like economics, generally play a part as well. Race (and racism) are closely related to ethnicity, in that both ethnicity and race have been used to separate people, and some ethnicities can be associated with particular races.
Another discriminating factor in our culture deals with sexual orientation and how people of different sexual orientation are often isolated and marginalized because of their orientation. Similar to ethnicity and race, sexual orientation is not a choice but rather a trait that is part of one’s identity. The LGBT community is compelled to fight for the same basic rights that are afforded to heterosexual couples and individuals through political organizations and awareness. One of the most notable organizations is the Human Rights Campaign.
The next chapter also deals somewhat with human identity and delves further into nations and nationality.
7.7 KEY TERMS DEFINED
Acculturation: Cultural change, generally the reconciliation of two or more cultural groups.
Discrimination: Mistreatment due to perceived differences.
Diversity: Having a range of different people.
Enclave: Self-enforced separation for a racial or ethnic group.
Environmental Justice: The concept that environmental benefits and burdens should be equally shared across different socio-economic groups.
Ethnic cleansing: An attempt to completely expunge or remove traces of another population from a place. May or may not relate to genocide.
Ethnicity: A group of people sharing a common cultural or national heritage and often sharing a common language or religion.
First effective settlement: A doctrine in which the first group that can assert dominance provides the template for the future society.
Foodway: The cultural, social, and economic practices relating to the production and consumption of food.
Genocidal: Having the purpose of exterminating an entire people.
Ghetto: An area of externally forced and legally defined ethnic or racial separation.
Hate crime: A crime, typically one involving violence, that is motivated by prejudice on the basis of ethnicity, religion, sexual orientation, or similar grounds.
Heterosexual: A person who is sexually or romantically attracted to people of the opposite sex: a heterosexual person.
Homosexual: A person who is sexually or romantically attracted to people of their same sex: a gay person and especially a male gay person or a female lesbian person.
Immigration: Incoming migration to a place.
Jim Crow: A set of laws enforcing racial segregation and disenfranchisement in the southern United States in the post–Civil War era.
LGBT: An acronym that stands for lesbian, gay, bisexual, and transgendered. Other current versions of the acronym include LGBTQIA+.
Majority: A group making up more than half of a population.
Minority: A group making up less than half of a population.
Nation: An ethnicity or a people.
Race: The categorization of humans into groups based on physical characteristics or ancestry.
Same-sex marriage: Marriage between same-sex couples.
Segregation: The spatial and/or social separation of people by race or ethnicity.
Xenophobia: A fear of the different.
7.8 WORKS CONSULTED AND FURTHER READING
Alcalay, Ammiel. 1992. After Jews and Arabs: Remaking Levantine Culture. 1st edition. Minneapolis: University of Minnesota Press.
Aluisio, Faith, and Peter Menzel. 2005. Hungry Planet. New York: Material World Books.
Baerwald, Thomas J. 2010. “Prospects for Geography as an Interdisciplinary Discipline.” Annals of the Association of American Geographers 100 (3): 493 5 1. https://doi.org/io. io8O/OOO456o8.2OIO 485443
Banerjee, Sarnath. 2004 Corridor: A Graphic Novel. New Delhi. New York: Penguin Books.
Black, Jeremy. 2000. Maps and History: Constructing Images of the Past. Yale University Press.
Brown, Dee, and Hampton Sides. 2007. Bury My Heart at Wounded Knee: An Indian History of the American West. 1st edition. New York: Picador.
Burton, Neel. “When Homosexuality Stopped Being a Mental Disorder.” Sexual Orientation, Psychology Today, 2023, www.psychologytoday.com/us/blog/hide-and-seek/201509/when-homosexuality-stopped-being-a-mental-disorder.
Cao, Nanlai. 2005 “The Church as a Surrogate Family for Working Class Immigrant Chinese Youth: An Ethnography of Segmented Assimilation.” Sociology of Religion 66 (2): 183–200.
DeSilver, Drew. “In Places Where Same-Sex Marriages Are Legal, How Many Married Same-Sex Couples Are There?” Pew Research Center, 13 June 2023, www.pewresearch.org/short-reads/2023/06/13/in-places-where-same-sex-marriages-are-legal-how-many-married-same-sex-couples-are-there/.
Dorrell, David. 2018. “Using International Content in an Introductory Human Geography Course.” In Curriculum Internationalization and the Future of Education.
“Facts about Suicide among LGBTQ+ Young People.” The Trevor Project, 28 Dec. 2023, www.thetrevorproject.org/resources/article/facts-about-lgbtq-youth-suicide/.
Fawcett, Emily. “LGBTQ in the Military.” Military OneSource, 22 Sept. 2023, www.militaryonesource.mil/relationships/support-community/lgbtq-in-the-military/.
Gillespie, Marie. 1995 Television, Ethnicity and Cultural Change. Psychology Press.
Gupta, Akhil, and James Ferguson, eds. 1997. Culture, Power, Place: Explorations in Critical Anthropology. N edition. Durham, NC: Duke University Press Books.
Halter, Marilyn. 2002. Shopping for Identity: The Marketing of Ethnicity. New York: Schocken.
Hear, Nicholas Van. 1998. New Diasporas: The Mass Exodus, Dispersal, and Regrouping of Migrant Communities. 1st edition. Seattle, WA: University of Washington Press.
Hutchinson, John, and Anthony D. Smith, eds. 1996. Ethnicity. 1st edition. Oxford; New York: Oxford University Press.
Kelley, Robin D. G. 1996. Race Rebel: Culture, Politics, and the Black Working Class. New York: Free Press.
Nunez, Christina. “Before Orlando: A History of Modern Anti-LGBT Violence.” History, National Geographic, 3 May 2021, www.nationalgeographic.com/history/article/orlando-nightclub-shooting-lgbt-gay-hate-crimes-history/.
Olsson, Tore C. 2007. “Your Dekalb Farmers Market: Food and Ethnicity in Atlanta.” Southern Cultures 13 (4): 45–58.
Que Vivan Los Tamales! n.d. University of New Mexico Press.
Sacks, Oliver. 1998. The Island of the Colorblind. 1st edition. Vintage.
Seal, Jeremy. 1996. A Fez of the Heart: Travels around Turkey in Search of a Hat. Houghton Mifflin Harcourt.
Sheerin, Jude. “Matthew Shepard: The Murder That Changed America.” BBC News, BBC, 26 Oct. 2018, www.bbc.com/news/world-us-canada-45968606.
Sorkin, Michael, ed. 1992. Variations on a Theme Park | Michael Sorkin. 1st ed. Macmillan. http://us.macmillan.com/variationsonathemepark/michaelsorkin
Lemann, Nicholas. 1990. The Promised Land: The Great Black Migration and How It Changed America. Vintage.
Van Mechelen, Niki, Debra De Pryck, Niki Van Mechelen, and Debra De Pryck. 2009. “YouTube as a Learning Environment.” https://www.learntechlib.org/primary/p/33021/.
Yang, Gene Luen. 2008. American Born Chinese. Reprint edition. New York: Square Fish.
7.9 ENDNOTES
- Data source: United States Census Bureau 2016 https://www2.census.gov/geo/tiger/TIGER_DP/2016ACS/ACS_2016_5YR_COUNTY.gdb.zip
- Data source: United States Census Bureau 2oih https://www2.census.gov/geo/tiger/TIGER_DP/2016ACS/ACS_2016_5YR_COUNTY.gdb.zip
- Data source: United States Census Bureau https://www2.census.gov/geo/tiger/TIGER_DP/2016ACS/ACS_2016_5YR_COUNTY.gdb.zip
- Data source: United States Census Bureau https://www2.census.gov/geo/tiger/TIGER_DP/2016ACS/ACS_2016_5YR_COUNTY.gdb.zip
- Data source: United States Census Bureau https://www2.census.gov/geo/tiger/TIGER_DP/2016ACS/ACS_2016_5YR_COUNTY.gdb.zip
- Data source: United States Census Bureau https://www2.census.gov/geo/tiger/TIGER_DP/2016ACS/ACS_2016_5YR_COUNTY.gdb.zip
- Data source: United States Census Bureau https://www2.census.gov/geo/tiger/TIGER_DP/2016ACS/ACS_2016_5YR_COUNTY.gdb.zip
- Data source: Adult LGBT Population https://williamsinstitute.law.ucla.edu/publications/adult-lgbt-pop-us/. Date accessed 1/6/2024.
- Data source: LGBTQ Youth Suicide Risk Map https://www.thetrevorproject.org/resources/article/facts-about-lgbtq-youth-suicide/. Date accessed 1/6/2024.
- Data source: Hate Crime Map https://www.hatecrimemap.com/. Date accessed 1/6/2024.
- Data source: Same-Sex Marriage Map https://www.lgbtmap.org/news/Marriage-Report-March-2022/. Date accessed 1/6/2024.
Media Attributions
- Chapter 7 Image
- Hispanic
- Asian 2010
- LGBT Population
- Suicide Map
- Hate Crimes
- Same Sex Map
