Chapter 13: Environment and Resources
CHAPTER 13: ENVIRONMENT AND RESOURCES
Joseph Henderson
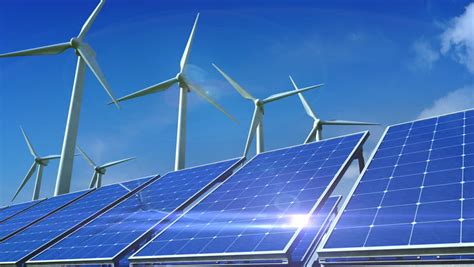
Solar Panels and Wind Turbines. Author | Source | License |
STUDENT LEARNING OUTCOMES
By the end of this section, the student will be able to:
Understand: the problems associated with the demand for nonrenewable energy resources and the available supply
Explain: the issues associated with the pollution of air, land, and water, as well as the concept of environmental justice
Describe: the types of renewable and alternative energy resources and global initiatives to leverage these resources
Connect: preservation efforts worldwide to anthropogenic pressures on the environment
CHAPTER OUTLINE
13.1 Introduction
13.2 Nonrenewable Energy Resources
13.3 Renewable Energy Sources
13.4 Pollution & Environmental Justice
13.5 Preservation of Natural Resources
13.6 Key Terms Defined
13.7 Works Consulted and Further Reading
13.1 INTRODUCTION
A discussion of resources makes an excellent capstone for this textbook, as most major topics that have been discussed previously relate to the consumption of resources in some way. Global population increase means a greater demand for resources. Job opportunities in fossil fuel mining and drilling are a significant pull factor for migration in many countries where fossil fuel extraction is an important part of the economy. Cultures, and their associated political and economic systems and settlements, affect and are affected by the availability of resources and how resources are used in a country. For example, as discussed in Ch. 9, the availability of coal in the United Kingdom helped bring about the Industrial Revolution in that country. Furthermore, as developing countries modernize, their energy needs for transportation and electricity grow, and there is a continued increase in the demand for such energy sources as fossil fuels.
13.2 NONRENEWABLE ENERGY RESOURCES
Fossil fuels are by far the most significant energy source for most countries worldwide, and these resources are nonrenewable, or in finite supply. Fossil fuels are burned in electric power plants and provide energy to power vehicles, aircraft, and ships. While the technology exists to burn fossil fuels in power plants so that the emissions are not particularly significant in terms of air pollution, air quality reduction because of the combustion of fossil fuels is still considerable and is a cause for concern at the international level.
Fossil fuels are formed from ancient living matter. In the case of coal, this fossil fuel was likely formed from primordial plant material in swamps that were buried and metamorphosed through time. The origin of oil and natural gas is attributed to microscopic organisms that sank to the bottom of prehistoric oceans and, over time, transformed into these two fossil fuels.
The countries that hold the greatest share of fossil fuel-proven reserves, or deposits that can be recovered with some certainty, are varied. For coal, the United States has the largest reserves, followed by Russia and China. In the case of oil, the vast majority of proven reserves are located in the Middle East in countries like Saudi Arabia (with the largest reserves) and Canada. Other countries that hold substantial reserves include Iraq and Venezuela. Lastly, for natural gas, Russia and Iran have the largest reserves. These statistics do not take into account potential reserves of fossil fuels, or fossil fuels that may exist but have not been definitively verified. One example of potential reserves in the United States is the Green River Formation in parts of Colorado, Utah, and Wyoming. This large deposit of shale rock may contain up to three trillion barrels of oil, only half of which is recoverable (7). 1.5 trillion barrels of oil, though, is roughly equivalent to the entire world’s proven oil reserves. The Green River Formation is not likely to be tapped because of complications associated with extracting oil from the rock, as the process would require heating the rock and using significant quantities of water in a rather arid region. Another example of potential reserves is the deposits of oil and gas in the Arctic, a region that has not been extensively explored, but the melting of sea ice caused by rising temperatures in the Arctic is increasing drilling opportunities.
The countries that have the largest reserves are not necessarily the countries with the leading amount of fossil fuel production. Production refers to the extraction of fossil fuels from the Earth by drilling and mining. The leading coal producers are China, India, and the United States, largely because of significant demands for electric power. The United States, Saudi Arabia, and Russia currently lead the world in oil production. Natural gas is extracted most heavily in the United States and Russia.
In the United States, the State of Louisiana has huge fossil fuel reserves and is a major player in the extraction and production of these fuels. According to the US Energy Information Administration, Louisiana has the 5th largest reserves of natural gas in the US and is in the top 10 in reserves and production of petroleum. Louisiana also has recoverable amounts of lignite coal.
13.3 RENEWABLE ENERGY SOURCES
Fossil fuel resources are finite, so efforts to seek other types of energy resources are ongoing in many countries around the world. Because fossil fuels are not limitless, some researchers are concerned that supply will eventually exceed demand, particularly as developing countries increase economically and technologically. Moreover, as we will see in a later section on pollution, the emissions from the burning of fossil fuels are a serious concern for the global atmosphere, and clean energy is seen as a better alternative to coal, oil, and natural gas.
The shift away from fossil fuels involves several different types of renewable energy and alternative energy sources. Renewable resources are those that are in infinite supply. Major types of renewable energy include solar, wind, hydroelectric power, biofuels, and geothermal energy. Although the risks are considered to be significant, an alternative energy source is nuclear power, but nuclear power is not renewable as it depends on the supply of uranium. Significant efforts worldwide to harness these energy sources can be seen in many regions of the world.
For example, in Europe, a concerted effort to fund renewable energy projects has been underway since the 1990s. In 2016, wind energy overtook coal as the second largest form of power production (after natural gas) in Europe, and 80 percent of new energy projects were from renewable energy sources. France, Ireland, Lithuania, the Netherlands, and Finland all set records for wind farm installation, while Germany continues to lead in wind power. Norway and Sweden are the leading countries overall in terms of renewable energy consumption in Europe, as more than half of their energy consumption is from renewables (Figure 13.1).
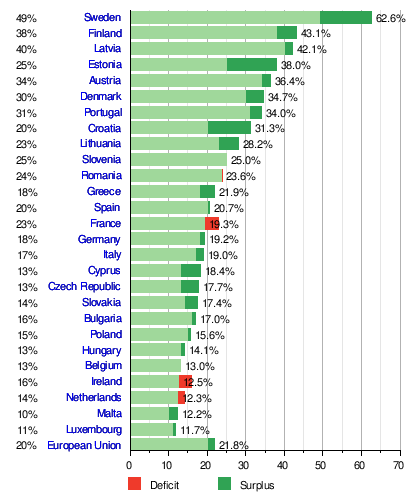
Figure 13.1 Renewable energy for selected countries in Europe; Author | Eurostat; Source | Flickr; License | CC BY SA 2.0.
In Asia, while China continues to build many coal-powered plants, it is investing hundreds of billions of dollars in renewable energy, more money than the United Kingdom, the United States, and Japan combined. This development is important as China is the world’s largest emitter of greenhouse gases, and this pollution may contribute to global warming. Moreover, China is already the world leader in wind power and plans to build the largest solar farm on the planet. India’s goal is to produce over 50 percent of its power from renewable energy by 2027. All of these efforts require a considerable amount of capital investment to help cover the costs of the energy transformation.
Even Saudi Arabia, second in oil production only to the United States, is looking toward renewable energy as they are expected to be a net importer of oil by 2038 as domestic supplies dwindle. The Middle East is an excellent location for solar power because of the number of cloud-free days each year.
In the United States, only about 20 percent of energy production is from renewables (USDOE 2023), and much of that production is from hydroelectric power. However, the US has some of the largest wind and solar farms in the world. Texas leads in wind power production, but other states are tapping into that source of energy, too (Figure 13.2). California has the most solar energy generating capacity. Efforts to promote electric car use have also been promoted by the federal government (through tax incentives for both manufacture and purchase) and by states like California, which, as a state, hopes to have 1.5 million electric cars on the road by 2025. Although using a battery to power a car instead of fossil fuels is generally environmentally friendly, electricity generated primarily from fossil fuels is still used to charge the vehicles.
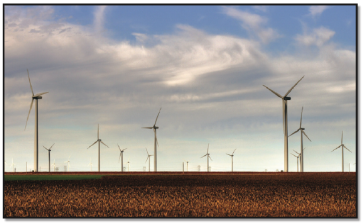
Figure 13.2 The Smoky Hills Wind Farm in Kansas; Author | User “Drenaline”; Source | Wikimedia Commons; License | CC BY SA 3.0.
Some states, like Louisiana, have yet to make a strong shift to renewable energy, in part because their energy production is strongly influenced by the high quantities of oil and gas resources there (Figure 13.3). As long as industries want cheaper fuel sources, it is unlikely that a move to renewables will occur as long as the largest consumer of energy is the industry (Figure 13.4).
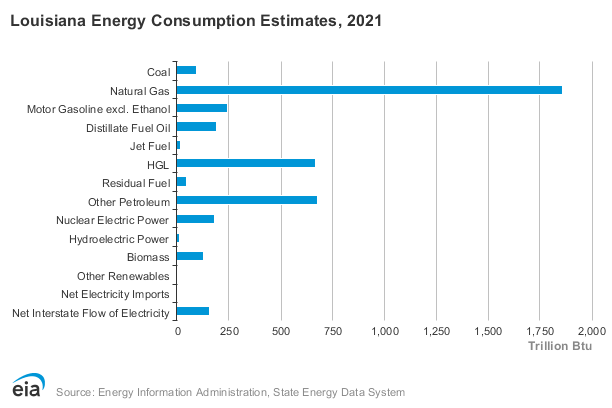
Figure 13.3 Louisiana’s Energy Mix; Author | US Energy Information Administration; Source | US Energy Information Administration; License | CC BY SA 3.0.
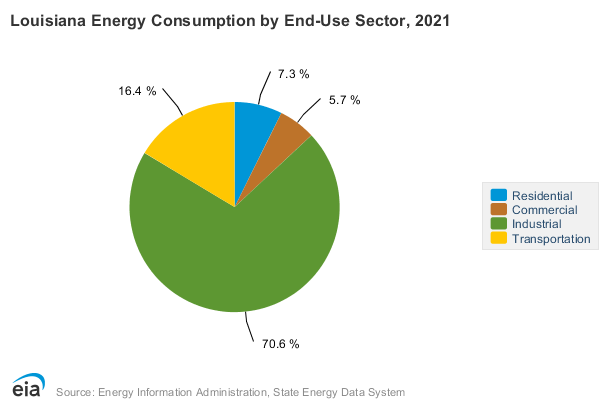
Figure 13.4 Louisiana’s Energy Mix; Author | US Energy Information Administration; Source | US Energy Information Administration; License | CC BY SA 3.0.
One of the more controversial types of renewable energy is biofuels. Biofuels produce energy from living matter, and much of the biofuel used in the world is from a variety of crops such as corn, cassava, sweet potato, sugar cane, and sorghum. The United States and Brazil lead the world in biofuel production, followed by China. In the United States, most gasoline has a certain percentage of ethanol, derived from corn. The major controversy with biofuels stems from the fact that many of the plants used for biofuels could also be used to feed people, so whether or not using scarce land to produce fuel as opposed to food is a good idea is hotly debated. However, other biofuel sources exist besides agricultural crops, and these biofuels include bio-methane and even bacteria such as E. coli. In the United States, India, and Germany, methane derived from cow manure and decaying plant matter is used to power electric plants. In Gwinnett County, Georgia, methane extracted during the wastewater treatment process is used to provide electric power for the wastewater treatment process (Figure 13.5).
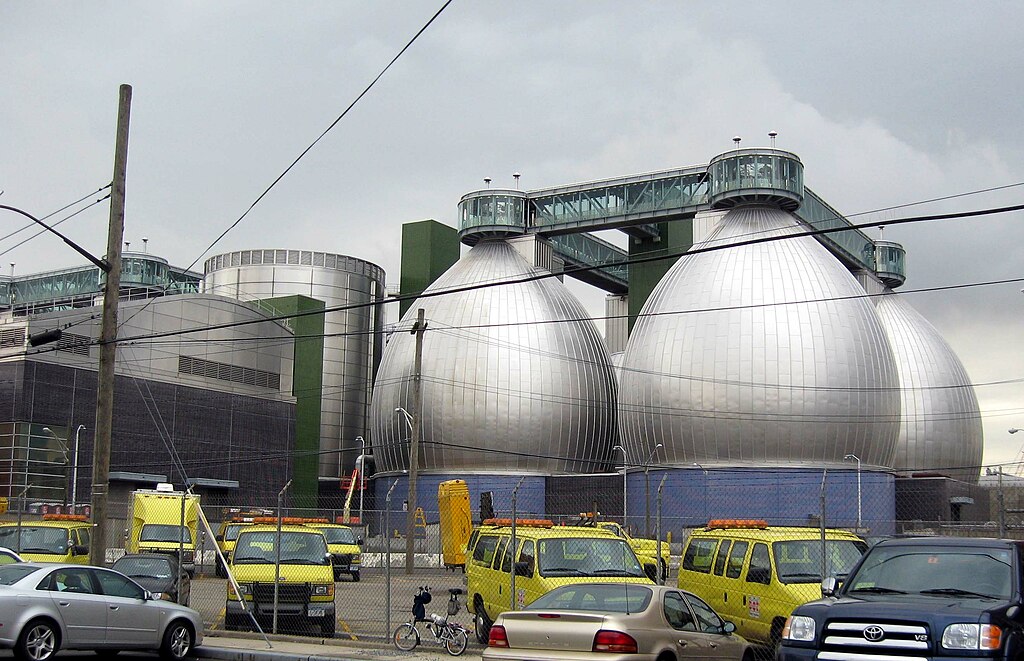
Figure 13.5 Egg-shaped “digesters” at the Newton Creek Wastewater Treatment Plant; Author | Jim Henderson; Source | Wikimedia Commons; License | Public Domain.
Louisiana is slowly incorporating renewable sources of energy. A hydroelectric facility, the Sidney A. Murray Jr. Hydroelectric Station, which is located on the Mississippi River approximately 200 miles upriver from New Orleans, has been in operation since the 1990s. Recently, biodiesel and ethanol facilities have been built along the Mississippi River to recycle waste oils and convert some of the state’s vast agricultural products, like sugarcane, to fuel. At the updating of this chapter (Summer 2023) offshore wind farms have been proposed for coastal Louisiana. Giant turbines will be built in clusters along the northern coast of the Gulf of Mexico; while these turbines will provide clean energy, they pose a significant hazard to migrating birds along the Mississippi Flyway. Additionally, several small solar farms have been constructed near the state capital, Baton Rouge, and others are proposed.
13.4 POLLUTION & ENVIRONMENTAL JUSTICE
13.4.1 Air Pollution
While the technology exists to burn fossil fuels so that the emissions are not particularly significant in terms of air pollution, air quality reduction because of the combustion of fossil fuels is still considerable and is a cause for concern at the international level. Another pollutant that has received worldwide attention is chlorofluorocarbons (CFCs) and their impact on the ozone layer.
One of the major issues internationally is the suspected anthropogenic, or human-caused, warming of the Earth’s atmosphere because of carbon dioxide in fossil fuel emissions. The issue is complex because “climate change,” as global warming has been dubbed, is affected by both natural and anthropogenic processes. Scientists are concerned with warming temperatures in the lower atmosphere because this warming could contribute to rising sea levels, an increase in the frequency of storms and drought, a greater number of heat injuries, and the spread of tropical pests into higher latitudes. Many climatic factors operate to affect global temperatures, so carbon dioxide produced by the burning of coal, oil, and natural gas is not the only important element that dictates temperatures worldwide. Ocean currents, shifts in large warm and cold pools of the oceans such as El Niño/La Niña, changes in sunspot activity, photosynthesis from global plant life, the extent of global sea ice, the type and extent of global cloud cover, the natural cycling of carbon, and volcanic activity are but a few of the climate controls of global temperatures.
Despite the complexity of the Earth’s climate system, many scientists attribute the warming (degrees C) of the average temperature of the Earth since the Industrial Revolution to increased levels of carbon dioxide, a natural component of the Earth’s atmosphere. Scientists have been measuring atmospheric carbon dioxide in Hawaii since the 1960s, and the trend has been upward for virtually every year on record. The increase in carbon dioxide levels has been linked to the burning of fossil fuels. So, how does this increase in carbon dioxide relate to warming temperatures around the globe?
Scientists suspect that a natural phenomenon called the greenhouse effect is related to this warming. The greenhouse effect is the trapping of longwave radiation (heat) by certain greenhouse gases (carbon dioxide, sulfur dioxide, nitrogen dioxide, methane, etc.) in the lower atmosphere, as these greenhouse gases absorb and reradiate the heat from the Earth, essentially forming a blanket in the Earth’s lower atmosphere. Without the greenhouse effect, the Earth would be over 35°C cooler, and life on Earth would likely not exist. Global warming is thought to be related to the greenhouse effect because carbon dioxide is one of the many greenhouse gases that trap heat from the Earth, and by humans increasing the concentration of greenhouse gases in the atmosphere, the greenhouse effect is enhanced, leading to increased warming above and beyond the “natural” effect (Figure 13.6).
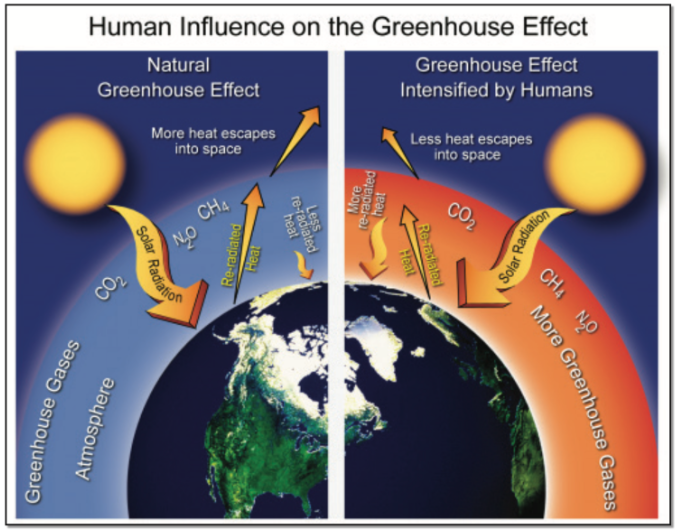
Figure 13.6 Natural and anthropogenically-forced greenhouse effect; Author | National Park Service and U.S. Global Change Research Program; Source | U.S. Global Change Research Program; License | Used with Permission.
International efforts to curb emissions of anthropogenic carbon began in earnest with the Kyoto Protocol in 1997. This agreement, signed and ratified by many countries around the world, sought to establish goals whereby countries would reduce their greenhouse gas emissions. The U.S. never ratified the treaty, particularly because India and China, two of the world’s biggest producers of carbon dioxide, were not required to reduce their emissions. However, the U.S. and other countries continued their dialogue about lowering emissions, and the recent Paris Climate Summit in 2016, signed by 194 countries,5 is the newest plan for global cooperation in carbon dioxide reductions. The plan’s goal is to keep global average temperatures at less than 2°C above preindustrial levels. While the United States announced its intention to withdraw from the Paris Agreement in 2017, the exit taking formal effect in 2020, it was readmitted in 2021.
Another example of international cooperation to decrease atmospheric pollutants involves the ozone layer. The ozone layer is in the stratosphere or upper atmosphere from 10–50 kilometers above the Earth’s surface. This important layer of ozone gas protects the Earth from harmful ultraviolet radiation that can be harmful to the skin by causing sunburn and skin cancer. Scientists believe that chlorofluorocarbons (CFCs), used in refrigeration equipment and aerosols, have damaged the ozone layer and caused it to become dangerously thin over some parts of the globe. This thinning of the ozone layer has been named an “ozone hole” and is most pronounced around the South Pole during the Antarctic spring (Figure 13.7).
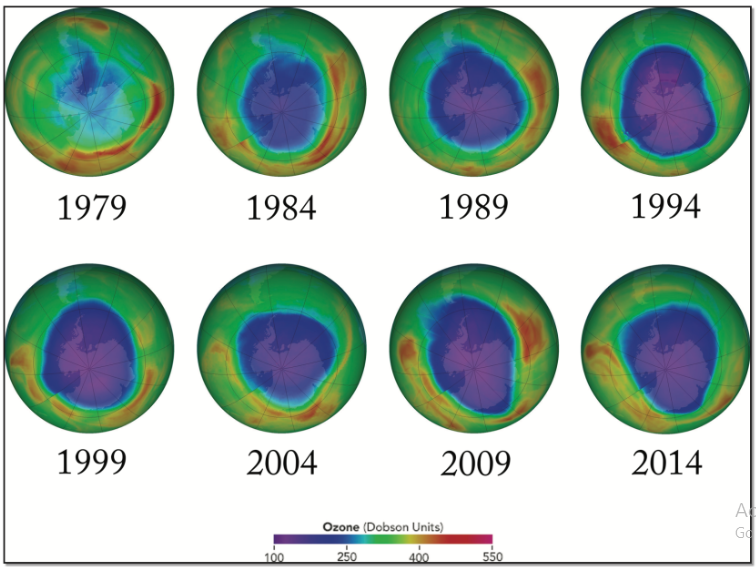
Figure 13.7 Ozone depletion around Antarctica from 1979 to 2014; Author | NASA; Source | NASA; License | Public Domain.
In response to these scientific findings, in 1987, 105 countries signed an international agreement known as the Montreal Protocol. The participating countries agreed to reduce the consumption and production of CFCs and to cease producing CFCs by the year 2000. The Montreal Protocol process continues as countries work to find ever-better substitutes for CFCs. Although CFCs will linger in the upper atmosphere for many years, scientists have already seen evidence of recovery in the ozone layer.
13.4.2 Water Pollution
While air pollution of the atmospheric global “commons” is an international issue, pollution of water and land areas is likewise problematic. The supply of clean, fresh water for drinking and other uses such as irrigation is under stress as population pressure continues to increase demand. Many regions with water deficits experience periodic droughts that strain available supplies. Unfortunately, both ground and surface waters are being polluted both in the United States and abroad. Pollutants such as industrial chemicals, runoff from roadways, and untreated sewage place a heavy toll on water supplies.
Not only is unclean water unsafe to drink and in some cases unfit for irrigation purposes, but pollution can also have a deleterious effect on aquatic life. Large industrial spills, discharge from paper mills, and other types of pollutants can render a lake or stream devoid of life for considerably long periods. Another type of pollutant that is of considerable concern in the United States and abroad is commercial fertilizers used in large-scale agriculture. Although it would seem that fertilizers would encourage plant growth and help aquatic ecosystems thrive, the opposite is, in fact, true in many cases. Rainfall washes commercial fertilizers into surface lakes and streams, and these fertilizers increase the growth of algae. Through a process called eutrophication, the abundant algal blooms die, and in the process of decomposition of the dead plant material, large amounts of oxygen are consumed. The lack of oxygen can result in extensive fish kills. One stark example of the harmful effects of eutrophication can be seen in the Gulf of Mexico. The Mississippi River carries a significant load of commercial fertilizers, and where the river discharges into the Gulf, “dead zones” form at certain times of the year. The bottom and near-bottom portions of the Gulf can become almost devoid of marine life over several thousand square miles. As a result, the Gulf of Mexico has the second largest “dead zone” of depleted oxygen area in the entire world, with the largest being in the Baltic Sea (Figure 13.8).
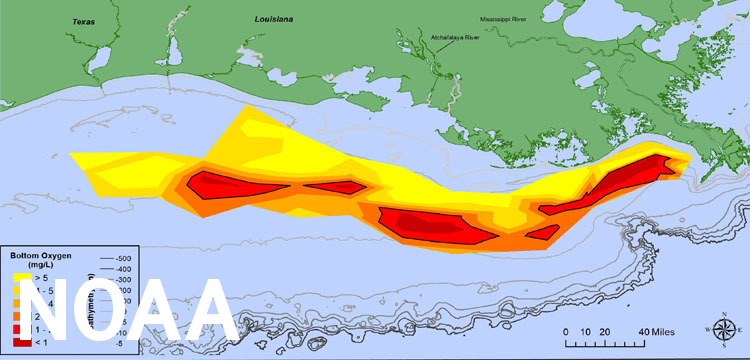
Figure 13.8 The 2020 Dead Zone in the Gulf of Mexico; Author | NASA NOAA; Source | NASA NOAA: License | Public Domain
13.4.3 Solid Waste
As countries struggle to maintain clean water sources, a related problem with pollution occurs with solid waste and its disposal. Solid waste that is buried beneath the ground may, over time, begin to pollute the groundwater below it. Water percolating downward through the rubbish can pick up harmful pollutants and deposit them in subsurface water sources. These groundwater reservoirs feed surface streams and are also tapped for well water. In the state of Florida, for example, the pollution of groundwater reservoirs, known as aquifers, is a significant issue because the state relies heavily on groundwater for its water supply.
Three primary solutions to the problem of solid waste are disposal in landfills, incineration, or recycling. In the United States, solid waste collectors pick up trash in cities and neighborhoods and transport the waste to landfills where it is buried daily to decrease the pervasive odor and protect it from marauding pests. This is the most common method of dealing with solid waste in the United States, but unfortunately, as urban sprawl expands towards areas where landfills are on the periphery of populated areas, the matter of residents having to live close to landfills is problematic. Moreover, landfills require extensive areas of land, and in some states with heavy population concentrations such as New York City, government officials have resorted to shipping their refuse into adjacent states such as Pennsylvania where space for landfills is more available.
Another less common alternative to landfills is incineration, a process made famous in Disney’s Toy Story 3 (Figure 13.9). At incineration facilities, trash is dumped into an enormous pile, and a claw-like machine picks up the trash and continually feeds the fire of the incinerator. The advantage of incineration is the vast reduction in the amount of trash that must be disposed of in landfills, and these facilities also generate electricity from the combustion of the burning trash. Because of its enormous output of daily solid waste, New York City takes advantage of incineration through a facility on the Hudson River just north of the city.
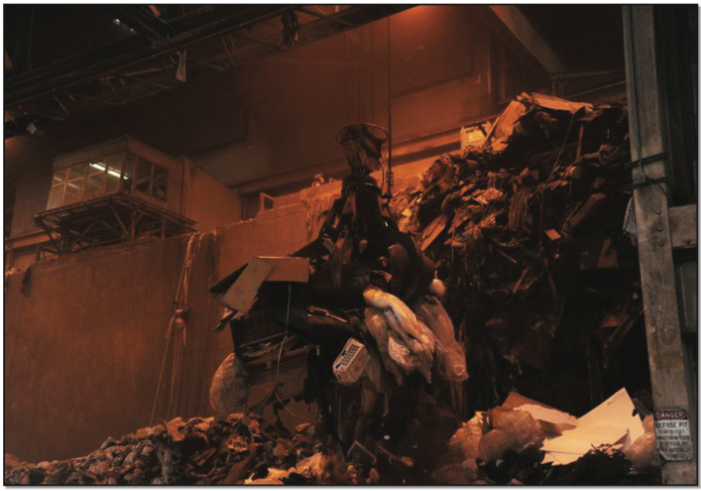
Figure 13.9 The “Claw” moving plant waste and rubbish to the incinerator; Author | Senior Airman Sam Fogleman; Source | U.S. Air Force; License | Public Domain.
Recycling involves the conversion of waste or other unwanted material into something reusable. Common wastes that are recycled include paper products, metals, plastics, and glass. In the United States, efforts to improve the percentage of waste material that is recycled instead of disposed of in trash disposal units are many. For example, Recycle–mania, started in 2001, is a nationwide competition amongst colleges and universities to promote student knowledge and participation in recycling. Despite efforts such as these, the United States only recycles about 30 percent of solid waste, even though approximately 75 percent of the waste is recyclable. In contrast, Germany recycles about 65 percent of its municipal waste and leads the world, followed closely by South Korea at 59 percent. Germany’s recycling emphasis reflects the generally strong emphasis on recycling in most European countries, thanks to rather strict recycling laws.
13.4.4 Environmental Justice
Environmental justice is a line of environmental thinking that focuses on the everyday places and environments of peoples’ lives. This stands in stark contrast to other conceptions of environmentalism, largely centered in mostly-white middle-class American suburbia, that focus on nature as a place “out there”—wilderness and its protection. According to the Environmental Protection Agency, environmental justice is “the fair treatment and meaningful involvement of all people regardless of race, color, national origin, or income, concerning the development, implementation, and enforcement of environmental laws, regulations, and policies” (EPA, 2022).
The environmental justice paradigm and movement found its roots in the late 1970s and Warren County, North Carolina. At the time, among the state’s most impoverished and with the state’s highest proportion of Black residents (62%), Warren County was selected to host a hazardous waste landfill to dispose of highly toxic polychlorinated biphenyls (PCBs). Significant grassroots resistance to the government’s plans ensued, under the auspices of groups like Warren County Citizens Concerned (WCCC) and the United Church of Christ’s Commission for Racial Justice (UCC CRJ)—as many residents viewed their community as having been made a target due to its racial and economic makeup. In this sense, the environmental justice movement can be seen as a fusion of the once distinct environmental and civil rights movements. Forming human barriers to block trucks loaded with PCBs headed for disposal, hundreds of demonstrators were arrested.
Far from an aberration, environmental justice pathbreakers like Rev. Benjamin Chavis and sociologist Robert Bullard found that the locations of hazardous industry and waste disposal often fell along lines of race and class—with nonwhite and poor communities facing disproportionately high toxic environmental exposure. The terms environmental racism (coined by Rev. Benjamin Chavis of the UCC CRJ and, later, CEO of the NAACP) and environmental classism describe this phenomenon.
Louisiana’s petrochemical corridor, commonly referred to as “Cancer Alley,” extends across the 85-mile stretch of the Mississippi River between Baton Rouge and New Orleans. This area, home to a high concentration of both Black and poor residents, is a major international hub for oil refining, petrochemical production, metallurgy, and hazardous waste disposal. According to the United States government’s Toxics Release Inventory (TRI) data for 2020, Louisiana ranks 4th highest out of 56 measured US states and territories for total toxic releases per square mile—with the densest concentrations of releasing sites located in the area between Baton Rouge and New Orleans (TRI, 2023). Of the nationwide total of roughly 550 million pounds of on-site discharges directly to the air, Louisiana alone tallied 49.5 million pounds (almost 10% of the national total) (TRI, 2023). Within the seven-parish corridor, there are over 200 sites with toxic emissions at levels mandating government reporting.
The area has a history of grassroots environmental activism—hosting the highly-publicized Great Louisiana Toxics March in 1988 and groups today like Rise St. James, a faith-based organization countering the further expansion of petrochemical activity in the area. Sharon Lavigne, a native resident of St. James, Louisiana, and founder of Rise St. James, has been awarded the Goldman Environmental Prize (2021, often called the Green Nobel) and the Laetare Medal (2022, the highest honor for American Catholics) for her activism. Figure 13.10 shows a Rise St. James yard sign contesting the proposed siting of a new plastics plant in Welcome, Louisiana. Figure 13.11 shows EPA Administrator Michael Regan announcing a proposal to tighten oversight of toxic emissions in LaPlace, Louisiana. He is flanked by federal, state, and local officials, as well as members of Rise St. James and Concerned Citizens of St. John (another grassroots environmental justice organization based in St. John the Baptist Parish).

Figure 13.10 Rise St. James Yard Sign in St. James, Louisiana (2021); Author | Adam S. Dohrenwend; Source | Original Work; License | CC BY SA 4.0.
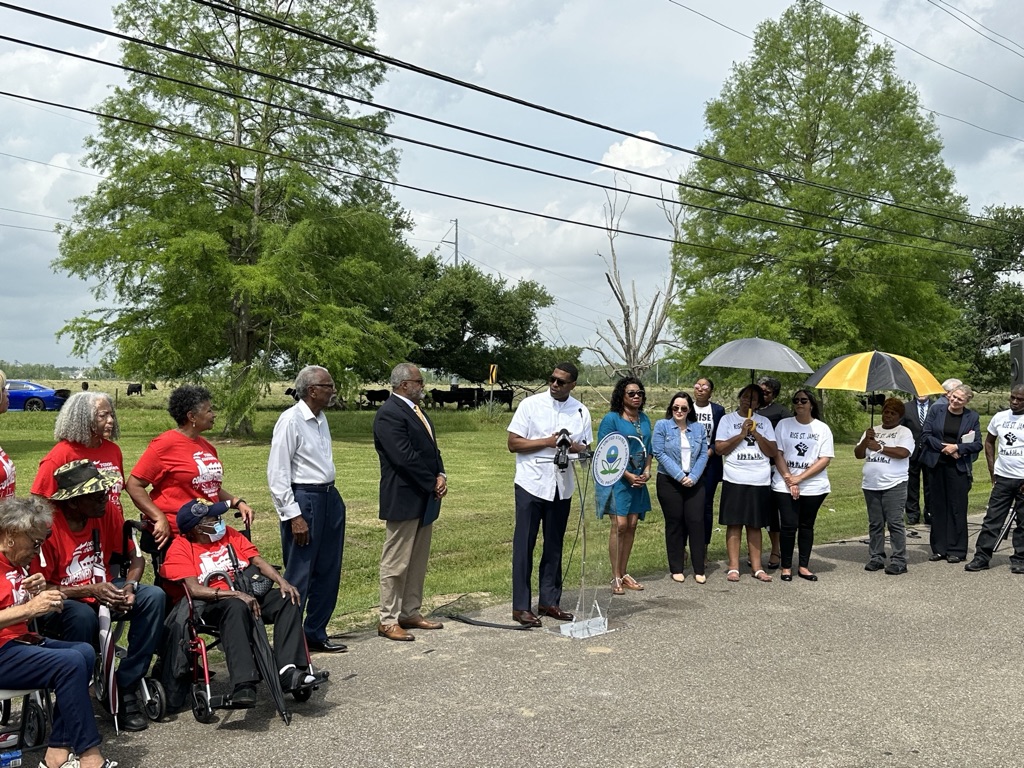
Figure 13.11 EPA Administrator Michael Regan Visiting LaPlace, Louisiana (2023); Author | Adam S. Dohrenwend; Source | Original Work; License | CC BY SA 4.0.
13.5 PRESERVATION OF NATURAL RESOURCES
Given the tremendous impact that human activities and settlements have on the environment, the question of how to preserve and protect the Earth’s land areas and its resources is particularly important, especially as the global population continues to grow. Two major concepts in this effort are conservation and preservation. Conservation involves using the Earth’s resources sustainably, which means they will be available to future generations. Ways in which conservation can be applied include not overfishing, replanting trees when they are logged, and protecting soil in farming areas from erosion. Preservation is the idea of protecting natural areas and trying to keep them as close as possible to their original, unspoiled state. As such, human impacts should be minimal, and resources in preserved areas are not for human use.
One of the foremost examples of preservation is the national park. Governments in nearly 100 countries worldwide have established these parks in wilderness areas where visitors can come and enjoy the scenery and the flora and fauna. The United States is a world leader in national parks, and the first national park in the world, Yellowstone, was created in the United States in 1872. However, the United States only has 59 national parks, much less than the 685 parks in Australia, the world leader in total parks. In Asia, China boasts the largest number of parks at over 200.
These parks help protect some of the most vulnerable plant and animal species in the world. For example, in the coastal mangrove forests of eastern India, the Bengal tiger, an endangered species, is protected in the Sundarbans National Park (Figures 13.12 and 13.13). Endangered species are species that are at risk of becoming extinct, and the International Union for the Conservation of Nature is an international organization aimed at protecting habitats, such as forests, and species around the globe (website at: https://www.iucn.org/). Deforestation is one of the greatest threats to endangered species, particularly in tropical rainforests in places like the Brazilian Amazon, as depicted in Chapter 1, but also in the United States in the forests of the Pacific Northwest, for example.
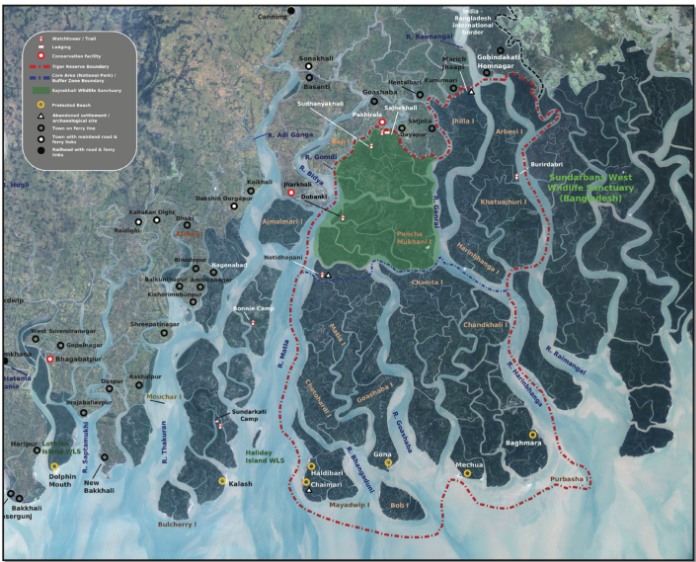
Figure 13.12 Sundarbans National Park, India; Author | User “Pradiptaray”; Source | Wikimedia Commons; License | Public Domain.

Figure 13.13 Tiger in Sundarbans National Park, India; Author | User “Pradiptaray”; Source | Wikimedia Commons; License | Public Domain.
Thousands of endangered species exist worldwide, and in the United States, the U.S. Fish and Wildlife Service oversees the identification, protection, and restoration of endangered species. The Endangered Species Act of 1973 protects vulnerable plants and animals in the United States, but the needs and demands of human development often clash with the preservation of habitat. With the world in the midst of one of the highest rates of extinction in the history of the Earth, the necessity to protect the remaining species from disappearing is a cause for alarm, both in the United States and abroad.
13.6 KEY TERMS DEFINED
Biofuels – energy sources from living matter.
Conservation – sustainably using natural resources so that they are preserved for future generations.
Environmental justice – the fair treatment and meaningful involvement of all people regardless of race, color, national origin, or income, concerning the development, implementation, and enforcement of environmental laws, regulations, and policies.
Eutrophication – the process by which nutrient-rich waters promote the growth of algae, and when the abundant algal blooms die, the decomposition of the dead plant material consumes large amounts of oxygen.
Fossil fuels – energy sources such as coal, oil, and natural gas derived from ancient plant and animal matter.
Greenhouse effect – the trapping of longwave radiation (heat) by certain greenhouse gases in the lower atmosphere; greenhouse gases absorb and reradiate the heat radiated from the Earth, increasing global temperatures by 35 degrees C compared to an atmosphere with no greenhouse effect.
Landfill – an area where solid waste is deposited and buried to reduce odor, vermin proliferation, and unsightly trash.
Nonrenewable resource – a resource that is in finite supply and is depleted by humans.
Potential reserves – estimates on available energy in deposits that are thought to exist but have not been completely verified.
Production – the extraction of fossil fuels from the ground.
Proven reserves – a state in which the territorial boundaries encompass a group of people with a shared ethnicity.
Preservation – setting aside areas so that resources are essentially untouched with as little human impact as feasible.
Renewable resource – a resource that is in infinite supply such as solar and wind energy.
13.7 WORKS CONSULTED AND FURTHER READING
“China Aims to Spend at Least $360 Billion on Renewable Energy by 2020.” The New York Times. December 22, 2017. Accessed April 23, 2018. https://www.nytimes. com/2017/01/05/world/asia/china-renewable-energy-investment.html.
US Energy Information Administration, US States Louisiana. Accessed July 9, 2023. United States – U.S. Energy Information Administration (EIA)
“Home.” ETIP Bioenergy-SABS. Accessed April 23, 2018. http://www.biofuelstp.eu/ global_overview.html.
Kirk, Ashley. “Paris Climate Summit: Which EU Countries Are Using the Most Renewable Energy?” The Telegraph. November 30, 2015. Accessed April 23, 2018. http://www. telegraph.co.uk/news/earth/energy/renewableenergy/12021449/Renewableenergy-in-the-EU-Which-countries-are-using-the-most-renewable-energy.html.
Kleven, Anthony. “Powering Asia’s Renewable Revolution.” The Diplomat. January 07, 2017. Accessed April 23, 2018. https://thediplomat.com/2017/01/poweringasias-renewable-revolution/.
“Paris Agreement.” Wikipedia. April 23, 2018. Accessed April 23, 2018. https:// en.wikipedia.org/wiki/Paris_Agreement.
Younes, L., A. Shaw, & C. Perlman. “In a Notoriously Polluted Area of the Country, Massive New Chemical Plants Are Still Moving In.” ProPublica. October 30, 2019. Accessed July 19, 2023.
Torgerson, Ross. “Untapped: The Story behind the Green River Shale Formation.” Bakken.
com. November 06, 2014. Accessed April 23, 2018. http://bakken.com/news/ id/225072/untapped-story-behind-green-river-shale-formation/.
US Environmental Protection Agency, 2021, 2020 Toxic Release Inventory Factsheet: Louisiana. Accessed July 16, 2023.
Vaughan, Adam. “Almost 90% of New Power in Europe from Renewable Sources in 2016.” The Guardian. Accessed April 23, 2018. https://www.theguardian.com/ environment/2017/feb/09/new-energy-europe-renewable-sources-2016
Media Attributions
- Solar Wind image
- ors84twj0pydrep5xnv8qcmgyamz45c
- Wind Farm
- Kingsland_Avenue_3_digester_tanks_jeh
- Human Influence on Greenhouse Effect
- Ozone Depletion
- Claw
- Sundarban Park
- Tiger Sundarban Park
