Chapter 3: Migration
Todd Lindley and Neusa Hidalgo Monroy Wohlgemuth
STUDENT LEARNING OUTCOMES
By the end of this section, the student will be able to:
Understand: definitions of migration and associated significant terms
Explain: the geographic patterns of migration within and between countries as influenced by economic, sociocultural, political, and environmental factors in the contemporary historical period
Describe: the general relationship between demographic factors and migration across time
Connect: factors of globalization to recent trends in migration
CHAPTER OUTLINE
3.1 Migration and Geography: A (Very) Brief History
3.2 Definitions and Data
3.3 Global, National, Regional, and Local Patterns
3.4 Demographic Transition, Migration, and Political Policy
3.5 Culture, Globalization, and Economics of Migration in the 21st Century
3.6 The Future of Human Movement and Summary
3.7 Key Terms Defined
3.8 Works Consulted and Further Reading
3.9 Endnotes
3.1 MIGRATION AND GEOGRAPHY: A (VERY) BRIEF HISTORY
For most of early human history transhumance, or the seasonal migration of people following the herds as they move for new feeding grounds, was the norm until about 65,000, when the first long-distance permanent migration (a permanent move to a new location) out of East Africa is believed to have happened, taking them to all corners of the ecumene (inhabited areas of the world) over tens of thousands of years. Scientists disagree on the specific periods; some studies suggest that the big move may have started 120,000 years ago. There is also disagreement on the reasons behind this mass migration. Significant evidence suggests that periodic climate change may have played a major role. The earliest evidence of human remains in North America is also controversial; scientists tend to agree that the earliest evidence of human remains in North America dates to approximately 13,000 years ago, when humans are hypothesized to have crossed an ice bridge from Eastern Russia into Alaska during the last Ice Age, before spending the next several thousand years spreading throughout North and South America and the Caribbean. However, recent footprints found at White Sands National Park in New Mexico provide the earliest evidence of human activity in the Americas over 23,000 years ago based on radiocarbon dating of seed layers above and below the footprints. This corresponds to the height of the last glacial cycle, during something known as the Last Glacial Maximum, and makes them the oldest known human footprints in the Americas. Migration, in many ways, has been the most impactful of all human activities on the planet. Early migrations are central to the formation of the world’s languages and language families, the formation of the world’s largest religions, and the diffusion of culture and agriculture. Migration, in many ways, has been the most impactful of all human activities on the planet. Had humans never taken the journey, we all would still be in East Africa, just daydreaming about the rest of the earth!
3.2 DEFINITIONS AND DATA
Migration can be interregional (between regions), intraregional (within a region), or international (across national borders). Those moving in are immigrants, and those moving out are emigrants. Net migration is the difference between the number of immigrants and the number of emigrants in any given year. The United Nations provides data and analysis on immigration and emigration annually, but such figures depend largely upon government sources that are more reliable in some cases than in others. For example, the United States (US) maintains databases on immigrants of all types, including guest workers (those permitted to enter the country legally for a specific job and a specific period), students, tourists, asylum seekers (those seeking sanctuary from political, religious, gender, or ethnic persecution), and undocumented migrants (those inside of a country without proof of residency).
However, the US does not maintain or report data on those who have emigrated, except in those notable cases where individuals have renounced citizenship. Meanwhile, countries like Mexico and the Philippines track their overseas citizens regularly, acknowledging the realities of dual citizenship or residency. Return migration (a permanent return to the country of origin) also represents a significant flow of people but is often underreported. For example, up to one-quarter of Europeans that migrated to the US in the late nineteenth century eventually returned to Europe. In recent years, more people have migrated back to Mexico from the US than from Mexico to the US. The process of migration, then, is a complicated nexus of movement rather than a simple one-way, permanent, single-directional move from place A to place B.
Learn More
Explore new estimates of migration flows between and within regions for five-year periods, 1990 to 2010. Discover flows country-by-country.
American cultural geographer Wilbur Zelinsky identified a migration transition based on the phases of the Demographic Transition Model reviewed in Chapter 2. The migration transition is a change in the migration pattern in a society that results from the social and economic changes that also produce the demographic transition. According to the migration transition, international migration is primarily a phenomenon of countries in stage 2 of the demographic transition, whereas internal migration is more important in stages 3 and 4. As countries move from stage 1 to stage 2, they experience exponential growth in population due to declining death rates. Historically this increase in population has been relieved by emigration, beginning in 1800 with the onset of the Industrial Revolution in England first, followed by Northern Europe countries. The migrants found several young welcoming countries around the globe open to this new wave of immigrants to help expand and secure new territories in the United States, Australia, Brazil, and South Africa, among others.
As the Industrial Revolution moved to the East and Southern countries in Europe and beyond to Latin America, Asia, and more recently Africa, the new waves of immigrants have not always been equally welcome as before, as they migrate to more industrialized countries, forcing these immigrants to settle in cities.
Learn More: Louisiana Focus
Spanish explorers were the first Europeans to arrive. First came Panfilo de Narvaez in 1528 and then Hernando de Soto in 1543. However, they did not settle in the land for over 100 years. In 1682, French explorer Robert de La Salle sailed down the Mississippi River and claimed much of the interior of North America for France, calling this land the Louisiana Territory after King Louis XIV. The current state of Louisiana was just a small portion of this large territory. The city of New Orleans was established in 1718. It quickly became a major trade port for the territory as goods traveled down the Mississippi River and then to the Gulf of Mexico. New Orleans became the capital of the territory in 1722.
Large farms called plantations grew up near the cities and towns in the region. These plantations were responsible for the forced migration of hundreds of thousands of slaves from Africa to work the fields. Just before the Civil War in 1860, there were 331,726 enslaved people and 18,647 free people of color in Louisiana. Once slavery was abolished hundreds more were brought to work under contracts from India and other countries in Asia.
Despite the complex patterns and processes of migration, some general characteristics of migration and migrants were articulated by British demographer Ernst Ravenstein (1885), characteristics known as the laws of migration. Many of them still hold true 135 years later. Can you decide which are still true today?
- Most move only a short distance.
- Each migration flow produces a counter-flow of migrants.
- Long-distance migrants tend to move to major cities.
- Rural residents are more migratory than those in towns.
- Females migrate more inside countries.
- Males migrate more internationally.
- Economic factors are the main reason for migration.
In short, each of the “laws” generally holds true, with the notable exception of number five. Ravenstein theorized that males were more likely than females to migrate long distances to other countries because searching for work was the main reason for international migration, and males were much more likely than females to be employed. This held for U.S. immigrants during the nineteenth and much of the twentieth centuries when about 55 percent were male. However female immigrants to the United States began to outnumber male immigrants around 1970, and they now comprise 55 percent of the total. Female immigrants also outnumber males in other developed countries.
A variety of non-government organizations, research groups, and humanitarian entities also track the movement of people across borders and within countries in order to provide a deeper understanding of the causes and effects of migration locally, regionally, nationally, and globally. For example, the Migration Information Source offers a wealth of reports, analysis, and data visualization that dramatically enhance our geographic understanding of migration. The Pew Research Center conducts regular polls often focused on Latino populations in the US. Other non-profit organizations track the effects of immigration in the US and publish regular reports, but often they lack objectivity or editorial oversight, as the intent of such efforts is to achieve policy change to reduce immigration levels. For example, the Federation for American Immigration Reform—FAIR—is an organization motivated by the explicit desire to reduce the number of immigrants and to secure the traditional cultural heritage of European Americans. Likewise, the Center for Immigration Studies (CIS) presents data to support its stated vision “of an America that admits fewer immigrants” and to reduce immigration of all kinds in the twentieth century (Center for Immigration Studies).
Geographers have identified general trends in global migration, also known as North-South migration, in which most emigrants originate in poorer, developing countries and most destinations have traditionally been wealthier, developed countries. For most Americans and Canadians, this pattern is very familiar, as recent decades have seen unprecedented numbers of Latinos immigrate to the US to find higher-paying jobs and better opportunities and escape structural poverty in the developing world. Similarly, the recent patterns in Europe have seen record numbers of Eastern Europeans move west and north to earn higher wages than those available in their home country. However, such wage differentials do not tell the whole story. For example, wages in Chicago tend to be much higher than those in other parts of Illinois, but not everybody leaves rural Illinois just because they can earn a higher wage. Wages, though significant, only tell part of the story. Unless you are reading this text in Manhattan, Paris, or Hong Kong, you could most likely move tomorrow and find a job elsewhere that pays more than what you earn now (if you are working). Geographers recognize that attachment to place, cultural factors, desire to stay close to family/friends, and other factors play a powerful role in the decision to move or stay.
Another pattern that has remained consistent over time is that of highly skilled migrants, who tend to enjoy much greater freedom of movement than those with lower levels of education and fewer skills. For example, computer software engineers, database managers, and a host of other highly demanded skills lead to efforts by countries and corporations to attract the best and the brightest minds to immigrate to bring those skill sets into a country where they are in short supply. Countries often offer travel visas (temporary permission to enter a country) to those with highly demanded skill sets. Countries like Australia, Canada, and New Zealand utilize a points system to determine which of the highly skilled applicants will be granted permission to enter. The brain drain refers to the conceptual idea that when a wealthy country recruits the “best brains” from a poorer country, it can be damaging to the sending country, as many of the most qualified and talented groups of people are poached away by higher-paying opportunities. As such, the term brain gain refers to the benefits received by a country that receives all those “brains” without having to produce them from scratch! Recently, countries have also acknowledged the concept of brain waste, in which receiving countries fall short in utilizing the full range of human capital inherent in many immigrant populations. For example, nearly half of all immigrants to the US from 2011 to 2015 held at least a bachelor’s degree, but more than 2 million immigrants with college degrees continue to work low-skilled jobs because employers or governments do not recognize foreign-held degrees. Similarly, a brain-drain/brain-gain phenomenon occurs within some countries, such as the US. California and New York, for example, continue to draw the most highly trained and qualified people away from other states. Governments that wish to keep highly skilled people at home take such transfers of educated and highly skilled people very seriously.
Framing migration as a loss or gain, however, also does not tell the whole story. Most countries that send migrants also receive them. The US receives large numbers of immigrants, but it also is a country of emigration, whereby retirees choose to live outside of the US, or long-term migrants (who usually are US citizens) choose to return to their home country in retirement. Migration is neither inherently good nor bad; rather, it is complicated. This chapter seeks to tease out some (but not all) of the important characteristics of migration in the twenty-first century to help you gain a better understanding of a topic that too often is used by politicians to gain votes or credibility. Let us put those simplistic debates aside for a few minutes to consider the basic elements of migration around the world.
3.3 GLOBAL, NATIONAL, REGIONAL, AND LOCAL PATTERNS
3.3.1 Global Patterns
Though geopolitical and global economic forces change over time, it is useful to understand contemporary global, national, and regional patterns of migration as processes that vary by geography. The vast majority of people do not migrate internationally, yet migration makes a powerful impact globally. Just imagine what our world would look like if nobody ever moved! Latin America would have no coconut trees, the American Midwest would still be dominated by buffalos, and most humans would look very much alike—how boring! Instead, migrants across the globe diffuse new ideas, new genetic footprints, new diseases, new cooking styles, and new sports. While a small number of countries receive large numbers of newcomers each year, only 3.4 percent of the world’s population live outside of their birth country, so most places in the world are not significantly impacted directly by international migration. However, the dynamics of migration are undergoing a significant transformation, and the future is very difficult to predict. Humans have been on the move for over 60,000 years, so it is unlikely to come to a halt anytime soon. The number of international migrants grew to 281 million in 2020, meaning that 3.6 percent of the world’s people lived outside their country of birth that year, according to the United Nations’ International Organization for Migration (IOM), standing at 3.6 percent in 2020, up from 3.2 percent a decade earlier (Figure 3.1).
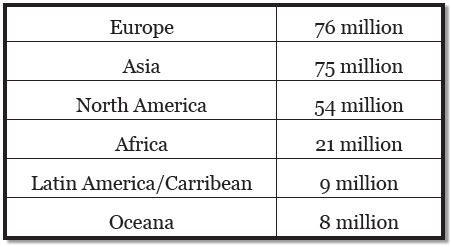
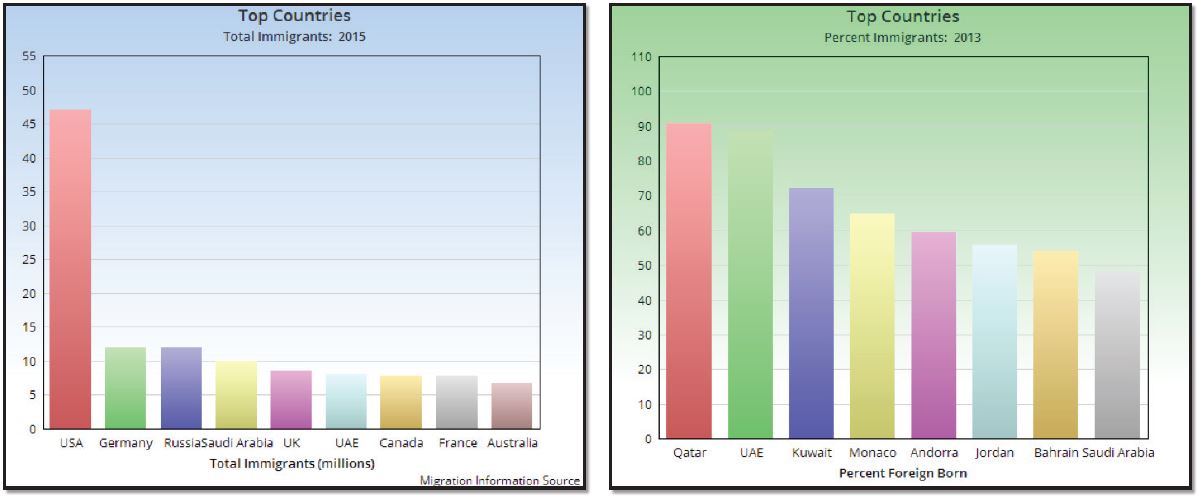
Cross-border migration seems to be accelerating in many parts of the world as more people have access to information, infrastructure, and communication—all elements that facilitate the large-scale movement of people. In 2015, nearly 70 percent of all migrants originated in either Europe or Asia, with the largest numbers coming from India, Mexico, Russia, and China. With nearly 51 million migrants in 2020, the U.S. leads the world on this measure by a wide margin (Figure 3.2).
Nearly two-thirds of all international migrants live in high-income countries, in contrast with just 31 percent in middle-income countries and around 4 percent in low-income countries. On the other hand, low- and middle-income countries hosted 80 percent of the world’s refugees in 2020. Refugees comprise around 3 percent of all international migrants in high-income countries, compared to 25 percent in middle-income countries and 50 percent in low-income countries. Generally speaking, migrants tend to move away from low/middle-income countries into high-income countries because the most common driving force is economic opportunity. Most migrants move for better jobs, higher incomes, and better opportunities overall. It is worth noting, however, that about one-third of international migration takes place between lower-income countries (e.g. from Bangladesh to India or from Afghanistan to Iran).
It is also important to note that patterns can change very quickly, depending on economic or political conditions. Spain, for example, was a major recipient of immigrants from 2000 to 2008, but when its economy dipped and job opportunities decreased, people began to leave en masse. In every year since 2011, more people have left Spain than have arrived. Ireland, on the other hand, experienced mostly net emigration from the mid-1800s until the late 1990s when large numbers of Irish and descendants returned “home” and new immigrants began to choose Ireland as a popular destination due to its improved economic opportunities under the European Union.
3.3.2 Regional Migration Flows: Europe
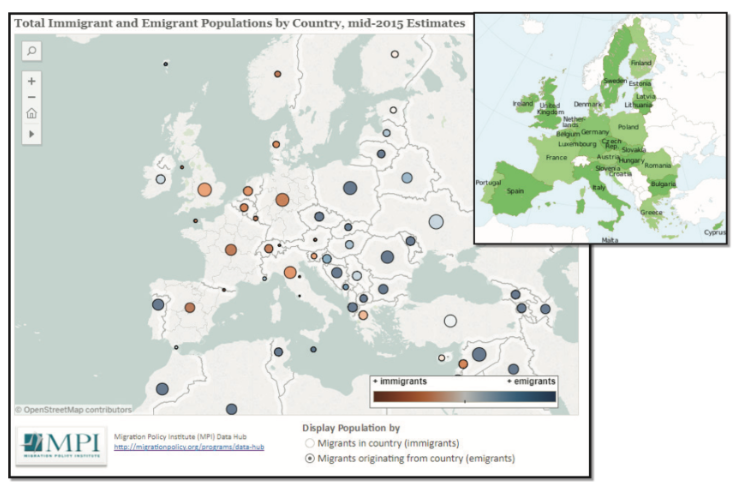
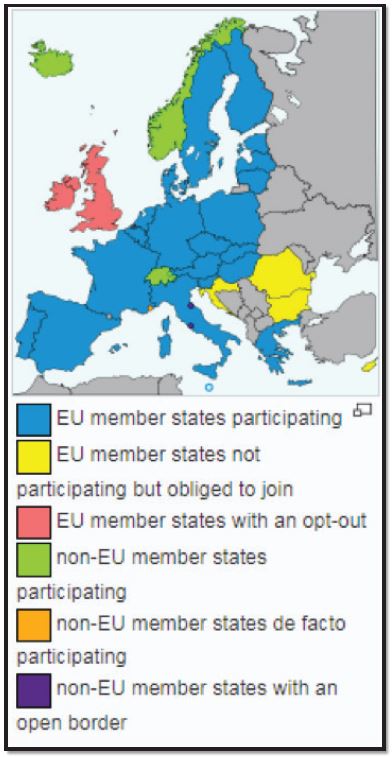
Consistent with Ravenstein’s “laws of migration,” most intenational moves continue to take place across relatively short distances. In no place is this more evident than in Europe, where it is also quite common to find Spaniards in France, Germans in Switzerland, Romanians in Germany, etc. As portrayed in the map below, movement within Europe tends to be from East (blue dots) to West (red/orange dots) (Figure 3.3). Given the ease of travel within, the small size of, and the short distances between many European countries, it is not surprising that many people move across borders for a variety of reasons. Of the 508 million residents of the European Union (EU), about 10 percent (54 million) are foreign-born, of which 35 million originate outside of the EU and 19 million moved from one EU country to another. Movement within and to the EU has accelerated in recent decades for two reasons. First, Europe has intentionally worked towards greater economic integration and cooperation since WWII by removing barriers to movement (see more about the EU in Chapter 8). Citizens and legal residents of participating EU member states may travel, live, study, and work seamlessly across national borders under the Schengen Agreement (Figure 3.4).
While the EU facilitates the free movement of capital, products, and services in the region, the agreement permits the free flow of people across international borders without significant delay, hassle, or regular security checks. Millions of working-age residents of Poland, Romania, and Bosnia, for example, have moved to countries like Germany, France, and Spain for higher wages. In some ways, the European region has become similar to the US in that Spaniards may travel to France just as easily as Californians may travel to Oregon.
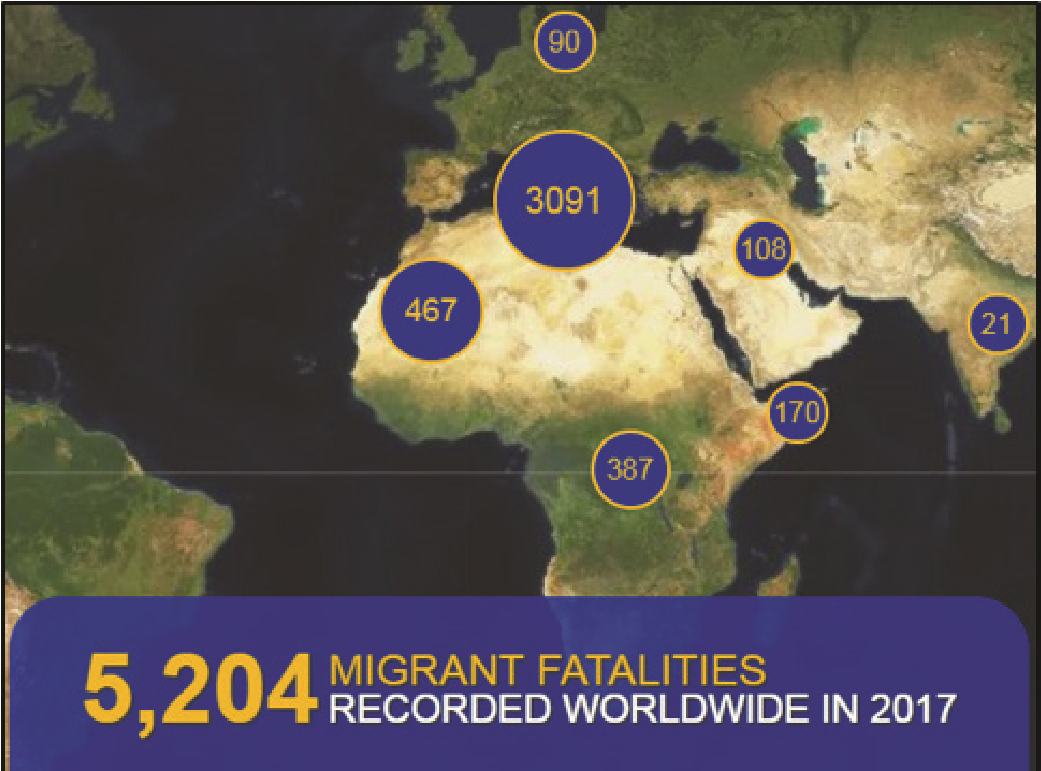
The second reason for increased movement and mobility in Europe, however, is that more people from nearby Africa and the Middle East have attempted to enter Europe to seek work, escape conflict, or find better educational opportunities. Although economic and political life has been relatively more attractive in Europe than in neighboring regions for some time, the forces of globalization have accelerated such flows. Human smuggling organizations transport hopeful migrants in exchange for large amounts of money. As such, the EU has increased maritime military patrols in the region, which has forced human smugglers and would-be immigrants into riskier, more perilous routes. Thousands die each year trying to gain entry to another country (Figure 3.5). In 2016, approximately 7,400 died during a migration route, and nowhere is the trek riskier than in the Mediterranean, where 4,800 migrants perished in 2016, most of whom were from African countries. Additionally, conflicts in the Middle East, most notably Syria, have driven hundreds of thousands to seek refuge in Europe.
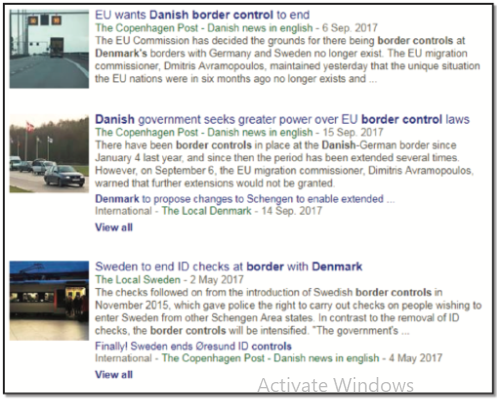
The free flow of people across the European region has come into question in recent years as northern member states mistrust the vetting process put into place by southern and eastern European states. An individual who manages to enter any of the Schengen states can travel quite easily to any of the other European states. Denmark and Sweden, for example, have increased border security and border checks despite being signatories to the agreement (Figure 3.6). The bold experiment in Europe to integrate so many cultural, linguistic, and political systems faces constant challenges and has no guarantee for long-term success. Twice in the last century, the region was war-torn. As the twentieth century unfolds, Europe remains a focal point for migration policy and practice into the twenty-second century.
3.3.3 Regional Migration Flows: North America
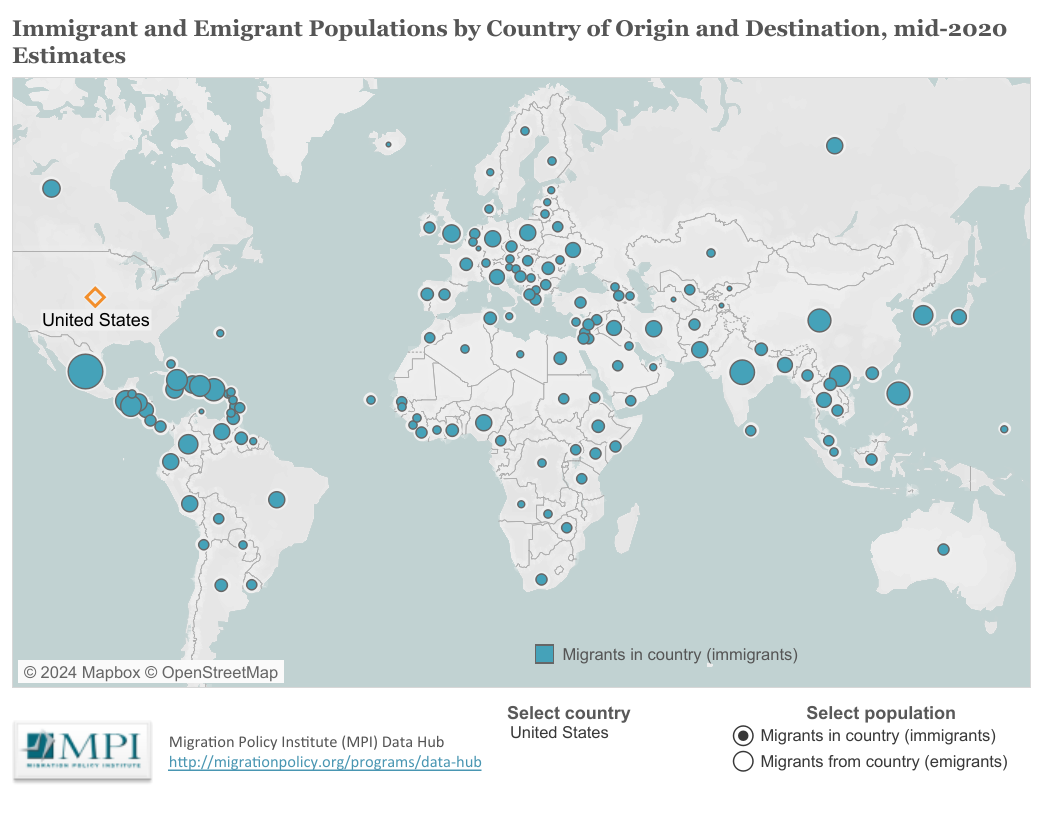
North America represents a special case in that the US routinely receives significantly more immigrants than any other country in the world. Roughly 14.5 percent (46 million) of all residents in the US were foreign-born in 2015, representing seventeen percent of the labor force. In 2021, immigrants comprised 13.6 percent of the total U.S. population, a figure that remains short of the record high of 14.8 percent in 1890 and slightly below the 13.7 percent share they comprised in 2019. In Canada, the numbers were roughly 21 percent for both categories. Roughly 75 percent of Canada’s population growth comes from immigration, mostly in the economic category. By 2036, immigrants will represent up to 30 percent of Canada’s population, compared with 20.7 percent in 2011. The International Organization for Migration (IOM), sponsored by the United Nations, offers a great tool for visualizing migration around the world (https://www.iom.int/ world-migrationhttps://worldmigrationreport.iom.int/wmr-2022-interactive/).
Click on the tool to find out how many in the US came from China or how many from the US lived in Mexico last year (hint: toggle the In/Out button).
Do you notice any patterns?
Click on a few other Caribbean countries to view the flows of migration into North America. You will notice that the largest source areas to the US were Latin America and Asia, but sending countries and volumes vary significantly over history.
The figure below shows changes over time in the US immigrant population, and you can see that immigration from Latin America and Asia has only occurred in the most recent period.
- Do you know or think you know when your ancestors arrived?
- Can you visualize the time period during which they first came to North America?
- Which population groups are not included in the chart?
- Why do you think this might be?
There are four distinct phases of immigration, but let’s examine each one briefly. First, during the era of frontier expansion (1820–1880), a rapid westward movement occurred. Settlers were given the rare opportunity to acquire large amounts of good farmland in the “New World,” which pushed people out of the large cities like New York and Boston and towards the American Midwest into the future states of Ohio, Illinois, Iowa, Nebraska, etc. Many immigrants came to the US specifically in search of land because population pressure in Europe made land acquisition very difficult. The Homestead Act of 1862 offered up to 160 acres of farmland to citizens or those planning to become citizens as long as they continuously lived on and farmed the land for five years. More than 1.5 million claims for land were made in subsequent years, resulting in a massive movement of people.
It was also during this era that the transcontinental railroad was completed, linking the East Coast and West Coast for the first time in a meaningful way. Most immigrants during this time came from England, Scotland, Ireland, Germany, and Scandinavia. More than 1.5 million also came from Ireland in just ten years (1845–1855) when the potato crop failed due to blight (disease), a period known as the Great Hunger. The only significant non-European immigrants arrived as a result of the Burlingame Seward Treaty of 1868, which welcomed Chinese workers, as China also opened its borders to American businesses, students, and missionaries. Migration from China was short-lived, however, during the subsequent era.
Phase 2 (1880–1910) ushered in a dramatic shift as the number of new arrivals soared to unprecedented levels. Moreover, the source countries also changed as immigrants began to arrive from southern and eastern European countries such as Italy, Greece, Russia, and Poland. American imagery, stories, legends, books, and films tend to focus heavily on this period, because it was the most intense era of movement from Europe, and most were arriving via Ellis Island by ship before settling into distinctly ethnic neighborhoods in cities across the US. It was also an era of massive industrialization that demanded a large source of low-cost workers, which immigration provided. Coal mines, steel mills, and factories were growing at unprecedented levels as the US raced to “catch up” with the great cities of the world, building bridges, skyscrapers, museums, sports stadiums, and other large structures at unprecedented levels. The period also produced a new era of exclusion as the Chinese Exclusion Act of 1882 prohibited immigration, naturalization, and citizenship for anyone of Chinese descent, including those who had immigrated previously under legal means.
During Phase 3 (1910–1965), the US dramatically curtailed the number of immigrants permitted to enter the country legally. The great Western settlement had ended, and high birth rates in the US created enough new workers to meet the demand of the continued industrialization of the country. A series of new exclusionary laws prevented all “Asiatic People” from entering the country, as American nationalism fanned by white power and eugenic movements sought to exclude and divide the people of the world into categories of “civilized,” “savage,” and “semi-civilized.” Also banned were “polygamists, anarchists, beggars, and importers of prostitutes.” (For an excellent graphical overview of US immigration legislation, visit the Pew Research Center website: http://www.pewhispanic.org/2015/09/28/selected-us-immigration-legislation-and-executive-actions-1790-2014).
During this period, immigration levels declined precipitously as the country grappled with questions of heritage, identity, and cohesion. National legislation was crafted to maintain the racial and ethnic balance of the country as mistrust between nations erupted in two world wars. Quotas were established to allow immigration of only a limited number of people from specific European countries, while all others were kept out. Ellis Island closed its doors in 1954 after having processed more than 12 million immigrants. However, a dramatic social shift was on the horizon, as the 1960s would dramatically alter US immigration in the coming decades.
Immigration into the US in the current era, Phase 4 (1965–Present), is characterized by (1) enormous growth and (2) a new diversity of source countries, dominated by the regions of Asia and Latin America. While the percentage of foreign-born residents is similar to that of the early 1900s, the 47 million (in 2016) living in the US represents an unprecedented historical high, with one out of every four children having at least one parent who is an immigrant. The Immigration and Naturalization Act of 1965 dramatically shifted the nature of immigration into the US from one with low numbers from a handful of predetermined countries to a system that favors those with particular skills (e.g. scientists, engineers, and doctors) and for family reunification. As more Americans entered college, the demand for manual labor also grew. Jobs that were once done by children and teenagers, such as harvesting crops, cutting grass, or washing dishes in restaurants, were increasingly being filled by immigrants willing to work long hours for little pay. Asian exclusion laws and quotas were abolished, as progressive civil rights–era provisions took a “colorblind” approach to welcome those from all regions of the world as long as they had the skills and education that would benefit the American economy. Laws also made it much easier for existing citizens to legally bring immediate relatives from abroad so that families would not be divided by restrictive immigration policies. Speaking to a sparse crowd in 1965 about the new immigration bill, President Lyndon B. Johnson said, this “is not a revolutionary bill. It does not affect the lives of millions . . . It will not reshape the structure of our daily lives or add importantly to either our wealth or our power.”1 Yet in the three decades after its passage, more than 18 million people arrived legally, tripling the number of immigrants from the previous three decades. The “face” of immigration changed dramatically. In 2016, the largest number of foreign-born were those from Mexico, China, India, the Philippines, and Vietnam. Moreover, immigrants are responsible for 25 percent of all new businesses and more than half of all start-up companies valued at more than $1 billion. Sometimes, presidents are wrong.
3.3.4 Regional Migration Flows: Asia
Migration within Asia is difficult to summarize given the massive size and scope of a region with 4.4 billion people! However, if you revisit the world migration map (https://www.iom.int/world-migration and https://worldmigrationreport.iom.int/wmr-2022-interactive/), you will notice that even the largest countries in the world (China and India) contain relatively few foreign-born people compared to those in Europe and North America. Can you think of reasons why this might be the case? The first explanation is simple. Large-scale human settlement and political development occurred much earlier than in Europe or in North America. Early Chinese civilizations had already emerged more than 5,000 years ago, and many in Asia can trace ancestral lineages back thousands of years as well. As such, Asia (for the most part) wasn’t “discovered,” conquered, or colonized during the time of European imperialism. Apart from a small number of missionaries, entrepreneurs, and adventurers, Asia did not become a major destination for those from foreign lands (there are several notable exceptions, particularly in the case of the British Empire). Second, most Asian countries simply do not allow for permanent immigration, except in the case of marriage (which also can be a very slow and tedious process). Nonetheless, in the age of globalization and migration, more people are on the move in Asia in the twenty-first century than ever before.
With a population of 1.412 billion (2021) and a fast-growing economy, China tends to dominate the East Asia region. The Chinese Diaspora is a term that refers to the 46 million people who identify themselves as Chinese but live outside of China, with the largest number making their homes in Southeast Asia and others in Australia, North America, or Europe. Many fled China during times of political instability before and after WWII and under early communist rule, but today, many of those who leave China are wealthy and educated and do so because their skills are in demand in other parts of the world.
The most significant movement of people anywhere in the history of the world has been taking place recently inside both China and India as rural farmers have been leaving the countryside and moving into cities. Nearly 200 million people have left the interior of China to re-settle and seek work in China’s dynamic cities, mostly located along the eastern part of the country. While they do not cross international borders, the distance and socioeconomic differences between rural and urban areas in China are very similar to an international move for many. The motivation is largely economic in that farmers can barely earn a few dollars a day in rural areas; new manufacturing jobs in coastal cities pay several times that.
3.4 DEMOGRAPHIC TRANSITION, MIGRATION, AND POLITICAL POLICY
3.4.1 What is the relationship between population structure and migration?
Even though people generally migrate to find/make a better life for themselves and their families, the benefits and pitfalls of migration affect different countries and regions in very different ways. Demography (age structure) has a lot to do with understanding how such a differentiation occurs. (Hint: You may need to go back to Chapter 2 to review your understanding of the Demographic Transition Model or click here: http://www.bbc.co.uk/schools/gcsebitesize/geography/population/ population_change_structure_rev4.shtml.)
The Demographic Transition Model explains how countries experience different stages of population growth and family sizes, but the model also works well to understand sources and destinations for migrants. Before the explanation continues, take a look at the model to see if you can predict the stages during which you would expect large-scale emigration versus immigration. Do you feel confident in your guesses? Why or why not?
Geographers note that countries of emigration tend to be in late stage 2 or early stage 3, while countries of immigration tend to be in late stage 4 or stage 5. Let’s think about this for just a moment. At what age are people most likely to take the risk to move to a completely different country to seek their fortune? Would you move to Slovenia next year if you could earn triple your current salary? Most international migrants tend to be relatively young (18-35), during the prime of their working years. Countries that tend to have an abundance of working-age people also tend to be in early stage 3 of the model. Countries like Mexico, Guatemala, the Philippines, and India had large families a generation ago. As those children enter their working years, there are not enough jobs created due to an “oversupply” of laborers. Meanwhile, countries in late stage 4 find that because of low fertility rates a generation earlier, the economy now faces a shortage of working-age residents to do all kinds of jobs. Birth rates were high during the 1950s in the US, but as women had fewer children in subsequent generations, fewer workers were entering the workforce every year. Unsurprisingly, young workers from Mexico, El Salvador, Jamaica, etc. began to immigrate as the demand for their labor increased. In Europe, the same pattern occurred as those from higher fertility countries like Turkey migrated to lower fertility countries like Germany.
3.4.2 Why do some countries benefit from migration while others do not?
Demographic realities can be push factors or pull factors that serve to push people away from a place or pull them towards a place as explained in the previous paragraph. Push and pull factors can be cultural, economic, or ecological. Baptists might be “pulled” towards the American South, and Mormons might be “pulled” to Utah for cultural reasons. Meanwhile, the devastation of Hurricane Maria (2017) “pushed” hundreds of thousands of Puerto Ricans off the island. The most common destination for Puerto Ricans was Florida for economic (jobs), ecological (warm weather), and cultural (existing Spanish speakers) reasons. When the push factors and pull factors fit together nicely, migration can benefit both the sending and receiving regions.
Very often in the case of forced migration, however, migration does not benefit both parties. Millions flee from armed conflicts, persecution, or human rights violations such as torture or other political crises. Some no longer feel safe and might have been targeted just because of who they are or what they do or believe—for example, for their ethnicity, religion, sexuality, or political opinions. People are fleeing from natural disasters, such as hurricanes, sea level rise, or volcanic explosions. Those migrants who flee their country based upon claims of danger based on race, religion, nationality, or other pertinent identifiers are known as asylum seekers. They seek a country willing to take them in permanently for fear of imprisonment, retribution, or death in their country of origin. When asylum seekers have satisfactorily demonstrated a claim in court, their status changes to a refugee. Under international agreement, refugees cannot be forced to return to any country where they are deemed to be in danger, so refugee status provides displaced people with legal protection against deportation. According to Amnesty International, in 2019 there were 26 million refugees globally. Half of the world’s refugees are children, and 85 percent of refugees are being hosted in developing countries. Over the past decade, just over 1 million refugees were resettled, compared to 3.9 million refugees who returned to their country. LOUISIANA: Four percent of Louisiana residents are immigrants, while another 4 percent of residents are native-born U.S. citizens with at least one immigrant parent. The top countries of origin for immigrants were Mexico (16 percent of immigrants), Honduras (15 percent), Vietnam (10 percent), the Philippines (5 percent), and Guatemala (4 percent).
In 2018, Immigrant entrepreneurs in Louisiana generated hundreds of millions of dollars in business revenue and contributed over a billion dollars in taxes. Louisiana residents in immigrant-led households had $3.5 billion in spending power (after tax).
3.4.3 Mapping Migration after Hurricane Katrina
3.4.3.1 Multicultural Stew
Latinx immigrants are having an impact on New Orleans. Let’s look at how they are affecting the U.S. city along with the city’s past immigration trends. In recent years, large numbers of asylum seekers have left Syria, Iraq, Afghanistan, Palestine, Somalia, Sudan, Cuba, Venezuela, and Myanmar (formerly Burma) as wars and political conflict have endangered millions. During previous wars, wealthier countries in Europe, North America, and Australia accepted large numbers of asylum seekers, but anti-immigrant sentiments have risen in many parts of the world, leaving the majority of would-be refugees without refuge. Opponents of resettlement argue that the cost is just too great, and they fear that accepting refugees would encourage more unwelcome immigration in the future, so this has significantly reduced the number of migrants that countries are willing to accept. Though in the twenty-first century, anti-immigrant sentiment remains high in countries like the US, Australia, and the U.K., the benefits of receiving countries are well documented. Apart from the demographic advantages already described, employers and consumers tend to benefit markedly from the low-cost, readily available supply of labor provided by immigrants. Everything from the cost of fruit, construction, fast food, and lawn care tends to be cheaper owing to an immigrant labor force. Evidence also indicates that wages in low-skilled jobs may be suppressed by immigrants, but the overall economic benefit is widely reported by economists to be favorable when unemployment rates are low. Immigrants have higher rates of employment, are more likely to start businesses, and are less likely to commit crimes than the native-born population in the US. Sending countries also tend to benefit from emigration in two ways. First, emigration provides an opportunity for young workers who cannot find employment at home. Second, emigrants tend to send home the majority of their overseas earnings. Money sent home by overseas workers is called remittances. Countries that send large numbers of workers overseas benefit from the large infusion of foreign capital into the local economy, which tends to spur new investment opportunities. When migration is working smoothly, both sending and receiving countries can benefit.
Besides low-skilled workers and refugees, a third category of immigrants has increased dramatically under globalization. Highly skilled immigrants represent a unique contradiction. On the one hand, countries seek to increase border security, limit asylum seekers, and build walls. On the other hand, those same countries actively recruit and seek to attract immigrants with specific skills, training, and educational levels. Most commonly, wealthy countries like the U.K. regularly recruit nurses, scientists, and engineers from poorer countries to meet the needs of an aging population. As British residents have fewer children and society gets older, there is more demand specifically for healthcare workers of all kinds. As such, the best and brightest minds from poorer countries become attracted to the much higher wages outside of their countries, and they leave—resulting in a brain drain. Nearly 60 percent of all doctors born in Ghana and 85 percent of nurses born in the Philippines have left the country to work elsewhere! Wealthy countries reap the benefits of this brain gain. Although highly skilled and educated individuals and families that emigrate for higher pay undoubtedly benefit from emigration, the countries that experience brain drain persistently lose a very valuable resource. Besides losing most of its doctors, Ghana also now faces a major shortage of those qualified to teach the next generation of medical professionals, so the negative effect crosses multiple generations.
3.5 CULTURE, GLOBALIZATION, AND ECONOMICS OF MIGRATION IN THE TWENTY-FIRST CENTURY
3.5.1 What is the connection between globalization and increased international migration?
Globalization is defined as the set of forces and processes that involve the entire planet, making something worldwide in scope. Although 246 million people live outside of their birth country, more than 96 percent of the world’s people do not ever move outside of their birth country, so in the case of migration, globalization might not be as powerful as once believed. While geographers try to understand where people move and why, a more significant question might be why so many people do not move. If you live in one of the places on Earth where you interact with people from all over the globe regularly, then it might seem to you that globalization is operating at full speed. Yet, the vast majority of humans don’t leave their home country and have limited interactions with people from other places, even if the products they consume and produce might be worldwide in scope. As we entered the new millennium in 2000, scholars were convinced that a new age was upon us. Some went so far as to say that geography was “dead” and that place didn’t matter. A best-selling book written by Thomas Friedman, The World Is Flat (2005), decreed that humanity was becoming more connected all the time to the point that it didn’t matter if you were in the streets of Bombay or in a classroom at Harvard. The best minds and the best ideas would always rise to the top, regardless of their origin. Inherent in this argument was the assumption that more people would be on the move, and international migration would accelerate as people and products would just zoom across the “flat earth” at lightning speed.
In 2017, however, geography re-emerged to re-stake its claim. While more people than ever are living outside of their birth countries, there is a growing resistance across the planet to “outsiders.” In response to the attacks of September 11, 2001, President George W. Bush firmly asserted that “every nation in every region now has a decision to make. Either you are with us, or you are with the terrorists.” Perhaps that is the moment in which the earlier hope of a fully integrated world with open borders and full mobility was deemed too optimistic. In the years since that speech, Western nations have taken a collective stance against immigration often based on religious or ideological grounds. In 2017, for example, Donald Trump called for a “total and complete shutdown of Muslims entering the United States” in response to a shooting in San Bernardino, California. Meanwhile, Britain moved to cut immigration levels dramatically as it exited the European Union and took a more isolationist position, and Australia moved to prevent refugees from arriving on its shores.
3.5.2 How is migration in the twenty-first century different from that of the twentieth century?
While the percentage of those who migrate has not increased significantly in the twenty-first century, the destinations and origins of immigrants have shifted dramatically, so that more people are migrating to and from more places than ever before. Such a statement may sound confusing at first, but one needs to look no further than college campuses throughout the world to understand this dynamic. Georgia Gwinnett College in suburban Atlanta, for example, is the most ethnically diverse college in the American South. In a typical geography class at that school, 33 percent speak a language other than English at home. A recent survey of the author’s students (n=115) from just one semester found that students (or their families) came from Mexico, El Salvador, Peru, the Philippines, Laos, China, Colombia, Korea, Haiti, Jamaica, Vietnam, Ukraine, Dominican Republic, Liberia, Latvia, Romania, India, Pakistan, Scotland, and Paraguay. While past waves of migration were dominated by a small number of sending countries and a small number of receiving countries, migration in the twenty-first century is much less predictable.
Australia offers another example, as thousands of prospective immigrants have been traveling thousands of miles by land and sea to seek refuge in the small continent. The government eventually made the difficult decision to intercept would-be immigrants at sea, but it still faces a complex dilemma of where to redirect those who have risked their lives to make the perilous journey. For now, they are being taken to the remote islands of Papua New Guinea, Christmas Island, and Nauru for resettlement, resulting in an odd mix of refugees and South Pacific Islanders living side by side. Unpredictability is now the rule rather than the exception as twenty-first century technology allows for a rapid flow of information. Those wishing to move can now find out much more quickly about opportunities, transportation options, and routes to take than has ever been the case before. Geography does not represent nearly as formidable of a barrier to travel as it did in the twentieth century. Other than asylum seekers, most immigrants are far more likely to travel by plane than by boat in the twenty-first century, and they may or may not seek permanent residence.
The final way in which migration is different today relates to the concept of transnationalism (exchanges and interactions across borders that are a regular and sustained part of migrants’ realities and activities that transcend a purely “national” space). Those traveling to the US in 1900 were leaving everything behind to seek a new homeland, learn a new culture, and often speak a new language. Migrants of today, however, are not forced to fully disconnect from “home.” Even after a long-distance migration, people can stay connected to friends, family, news stories, and relationships across the world. A journey that took several months in 1900 today takes less than half a day. Meanwhile, apps like Facebook, WhatsApp, Snapchat, and Skype allow newcomers to stay intimately involved in the lives of those left behind—for free! Transnational families contain members who are living in multiple countries simultaneously, speak multiple languages, and are ready to move at a moment’s notice, based upon market conditions in any given place at a particular time. Critics argue that immigrants of today do not assimilate as readily as those from the nineteenth and twentieth centuries, but in that era, people simply had no other choice. Transnationalism is a feature of twenty-first-century immigrants that is here to stay as immigrants to new places have the option to live their lives in more than one world, carry more than one passport, and move more seamlessly from place to place than at any time in human history. Take note that the term appears again in this textbook (section 11.4, Industry) in that corporations also operate within and between multiple countries, depending upon various factors. An important distinction exists, however, from the concept of supranationalism (section 8.6, Political Geography) in that supranational organizations do not officially reside under the direction of any single state (country), while transnationalism involves moving between countries—not operating outside of them.
3.5.3 Climate change and environmental refugees
Climate change and disaster displacement are the defining crises of our time. Entire countries are already suffering the impacts of climate-related emergencies, but vulnerable people living in the most fragile and poor regions are disproportionately affected by it and forced to move. Limited natural resources, such as drinking water, are becoming even scarcer in many parts of the world. Crops and livestock struggle to survive where conditions become too hot and dry or too cold and wet, threatening livelihoods. Volcanic eruptions, earthquakes, and other environmental hazards have also displaced entire populations. In 2018, the World Bank estimated that three regions (Latin America, sub-Saharan Africa, and Southeast Asia) will generate 143 million more climate migrants by 2050.
3.5.3.1 LOUISIANA
The effects of Hurricane Katrina, in what has been described as the biggest climate-driven migration since the Dust Bowl of the 1930s, forced more than a million people to flee from Hurricane Katrina in the 14 days after its impact on New Orleans. However, in the decades since the levees broke, the story of the Katrina diaspora has evolved into a tale of post-Katrina transplants. In 2011, New Orleans had a net increase of 3,167 households—7,668 households moved away, while 10,835 moved in. More than 6,280 households in other parishes in Louisiana moved into New Orleans. Nearly 1,100 arrived from Houston. Hundreds arrived from New York, Georgia, and California. The city’s population of 384,320 is still less than 80 percent of the 2000 Census count of more than 484,600. But it’s up from the post-storm count of 230,172.
3.6 THE FUTURE OF HUMAN MOVEMENT AND SUMMARY
The future dynamics of migration are very difficult to predict, but certain geographic realities provide clues for where patterns are likely to change. In those parts of the world where societies are quickly aging and fertility rates continue to decline, we can expect rates of immigration to increase. Certain countries have experienced and will continue to experience dramatic population decline (most notably Germany, Italy, Russia, and Japan), and the demand for young, working-aged immigrants will certainly continue to draw more people to those places. Japan and China represent unique cases because both are aging and yet have been resistant to allowing outsiders to become citizens or permanent residents. Despite cultural preferences for ethnic homogeneity, it would seem likely that the culture will shift and become more accepting of outsiders, as the country needs them to take care of the elderly, pay taxes, and provide an infusion of energy into the respective countries. Meanwhile, people living in places without sufficient opportunities will continue to move away in search of jobs and better circumstances, regardless of the attempts made by wealthy nations to keep them out. Source countries and destinations will continue to shift, as they always have. More Mexicans have returned than have left the US in recent years, and it is no longer the leading sending source country of migration to the US. Rather, more people are now coming from Central America. The demographic pressures in many African countries will drive more working-aged people out of the continent in search of better opportunities even as the journey becomes increasingly dangerous. As the Internet becomes more pervasive on that continent, more people will find the information that they need to plan their emigration. Finally, the highly skilled people of the world will continue to be increasingly mobile and largely unaffected by borders or increased security. Computer programmers, nurses, doctors, engineers, and high-tech workers of all sorts will use the globe to their advantage and seek out places that best fit their desires. Television shows like “House Hunters International” demonstrate how the vast numbers of people who work online or in highly skilled careers can virtually live anywhere. Wealthy people from across the globe are leaving their passport countries by the millions, as Wi-Fi networks are now available across the world. The poor and wealthy alike will continue to move about the planet, reconstituting the human geography of our world well into the twenty-first century but for very different reasons and with very different experiences.
3.7 KEY TERMS DEFINED
Asylum seekers – those who leave the sovereign territory of one country to achieve refugee status in another, based upon claims of danger because of race, religion, nationality, or other pertinent identifiers.
Brain drain – the collective loss of skills, education, training, and wealth that occurs when highly skilled and educated people move away from a country (usually away from a relatively poor country).
Brain gain – the collective gain of skills, education, training, and wealth that occurs when highly skilled and educated people move into another country (usually to a relatively wealthier country).
Brain waste – a phenomenon in which international migrants with high levels of education and/or training often are not eligible to work in their area of training due to regulations or certification requirements, resulting in a “wasted” potential in certain groups.
Diaspora – a group of people sharing a common historical and ethnic connection to a territory but who no longer live in that territory or country. Some members of a diaspora may have been removed from the traditional homeland for multiple generations but still identify with it as a “homeland.”
Ecumene – human-inhabited areas of Earth.
Emigrant – an individual who moves away from one country into another for a prolonged period. The definition of “prolonged” varies by country and is defined by the World Bank as a minimum of one year.
Forced migration – a type of movement in which individuals or groups are coerced into moving by an external set of forces, most notably environmental, economic, social, or political factors.
Globalization – all those processes, technologies, and systems that result in greater connections, communication, and movement among increasingly distant people and places on Earth.
Guest worker – someone without legal permanent status who has been granted permission to reside in a country’s territory to work for a specific set of time on a particular kind of work.
Highly skilled migration – patterns of movement by those with skills that are in high demand on the global market. Examples include nurses, doctors, IT specialists, actors/artists, and athletes who tend to enjoy greater levels of movement across borders than others.
Immigrant – an individual who moves for a prolonged period to another country. The definition of “prolonged” varies by country. In 2016 there were 246 million immigrants in the world.
Internally Displaced People (IDP) – those who have moved or been forced to move from a homeland for the same reasons as refugees but have not crossed an international boundary and do not have refugee status.
Laws of migration – generalizations about international migration as detailed by nineteenth-century demographers.
Migration – a permanent move to a new location.
Net migration – the difference between the number of immigrants and the number of emigrants in any given year.
Points system – a national immigration policy that seeks to attract people with a specific set of skills, experience, and job training to satisfy unmet demand among those currently in the country. Regardless of origin country, anyone with the prescribed set of skills, linguistic ability, and education may apply to migrate to that country if they have acquired enough points to do so. Canada, Australia, New Zealand, and England all have a points system.
Pull factors – those forces that encourage people to move into a particular place.
Push factors – those forces that encourage people to move away from a particular place.
Refugee – an individual who, owing to a well-founded fear of being persecuted for reasons of race, religion, nationality, membership of a particular social group, or political opinion, is outside the country of his nationality and is unable, or unwilling, to avail themselves of the protection of that country. An individual who has been granted “refugee” status is afforded a certain set of rights and privileges, most notably the right not to be forcibly returned to the country of origin.
Remittances – money sent “home” by international migrants. Remittances represent the largest single source of external funding in many developing countries. The global figure for 2016 was US $600 billion.
Return migration – a return of a migrant to the country or place of origin.
Transnationalism – exchanges and interactions across borders that are a regular and sustained part of migrants’ realities and activities that transcend a purely “national” space.
Undocumented migrants – those inside of a country without proper authorization or proof of residence.
Visa – the legal permission granted by a receiving country to those seeking to enter. Examples include tourist, temporary work, and student visas. A visa is different from a passport.
3.8 WORKS CONSULTED AND FURTHER READING
Boyle, Paul, and Keith Halfacree. Exploring Contemporary Migration. Routledge, 2014.
Castles, Stephen, Hein de Haas, and Mark J. Miller. The Age of Migration: International Population Movements in the Modern World. New York: Guilford Press, 2014.
Collins, Nathan. “Why—and When Did Early Humans Leave Africa?” Pacific Standard, September 21, 2016. https://psmag.com/why-and-when-did-early-humans-leaveafrica-c1f09be7bb70#.p0wpltf4t.
Cornish, Audie. “This Simple Puzzle Test Sealed the Fate of Immigrants at Ellis Island.” National Public Radio, May 17, 2017. http://www.npr.org/2017/05/17/528813842/ this-simple-puzzle-test-sealed-the-fate-of-immigrants-at-ellis-island.
Czaika, Mathias, and Hein de Haas. “The Globalization of Migration: Has the World Become More Migratory?” International Migration Review 48, no. 2 (Summer 2014): 283–323. https://doi.org/10.1111/imre.12095.
Donald, Adam. “Immigration Points-Based Systems Compared.” BBC News, June 1, 2016. http://www.bbc.com/news/uk-politics-29594642.
Eurostat. “Migration and Migrant Population Statistics.” http://ec.europa.eu/eurostat/ statistics-explained/index.php/Migration_and_migrant_population_statistics.
Global Migration Group: http://www.globalmigrationgroup.org.
International Organization for Migration. “Missing Migrants Project.” https:// missingmigrants.iom.int.
Jennings, Ralph. “Taiwan Gambles on Visa-Free Entry For Citizens of the Poorer Philippines.” Forbes, May 15, 2017. https://www.forbes.com/sites/ ralphjennings/2017/05/15/modern-taiwan-gambles-on-visa-waiver-for-citizensof-the-poorer-philippines/#5a8489656ab7.
Koh, Yoree. “Study: Immigrants Founded 51 Percent of US Billion-Dollar Startups.” The Wall Street Journal, March 17, 2016. https://blogs. wsj.com/digits/2016/03/17/study-immigrants-founded-51-of-u-s-billion-dollarstartups.
Migration Policy Institute. https://www.migrationpolicy.org.
NBC News. “Trump Calls for ‘Complete Shutdown of Muslims Entering the US.’” Meet the Press, December 7, 2016. https://www.nbcnews.com/meet-the-press/video/ trump-calls-for-complete-shut-down-of-muslims-entering-US-581645891511.
Oxford Bibliographies. “The Chinese Diaspora.” 2013. http://www.oxfordbibliographies.com/view/document/obo-9780199920082/obo-9780199920082-0070.xml.
Ratha, Dilip. “Understanding the Importance of Remittances.” Migration Information Source, October 1, 2004. https://www.migrationpolicy.org/article/understandingimportance-remittances.
Russell, Sharon Stanton. “Refugees: Risks and Challenges Worldwide.” Migration Information Source, November 1, 2002. https://www.migrationpolicy.org/ article/refugees-risks-and-challenges-worldwide.
United Nations Department of Economic and Social Affairs/Population Division. International Migration Report 2017. http://www.un.org/en/development/desa/ population/migration/publications/migrationreport/docs/MigrationReport2017.pdf.
United Nations Department of Economic and Social Affairs/Population Division. International Migration. http://www.un.org/en/development/desa/population/ migration.
Voice of America. “Ghana Faces Worrying Brain Drain.” Voice of America News, January 9, 2010. https://www.voanews.com/a/ghana-faces-worrying-braindrain-81090582/111371.html.
World Bank Group. “Migration and Remittances Factbook 2016.” https://openknowledge. worldbank.org/bitstream/handle/10986/23743/9781464803192. pdf?sequence=3&isAllowed=y.
Zong, Jie, and Jeanne Batalova. “Annual Refugee Resettlement Ceiling and Number of Refugees Admitted, 1980–2017.” Migration Information Source, June 7, 2017. https://www.migrationpolicy.org/article/refugees-and-asylees-unitedstates#Admission_Ceiling.
3.9 ENDNOTES
1. Public Papers of the Presidents of the United States: Lyndon B. Johnson, 1965. Volume II, entry 546, pp. 1037–1040. Washington, D.C.: Government Printing Office, 1966.
Media Attributions
- Dashboard 1
- European Migration
- European News Headlines 2017
