Chapter 4: The Integral
Chapter 4 Review Problems
Chapter 3 Review Problems
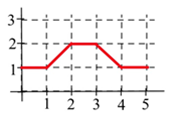
- Let A(x) represent the area bounded by the graph and the horizontal axis and vertical lines at t=0 and t=x for the graph in Fig. 1. Evaluate A(x) for x = 1, 2, 3, 4, and 5.
- Let B(x) represent the area bounded by the graph and the horizontal axis and vertical lines at t=0 and t=x for the graph in Fig. 2. Evaluate B(x) for x = 1, 2, 3, 4, and 5.


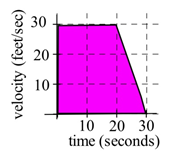
3. A car had the velocity shown in Fig. 3. How far did the car travel from t= 0 to t = 30 seconds?

4. The velocities of two cars are shown in Fig. 4.
(a) From the time the brakes were applied, how many seconds did it take each car to stop?
(b) From the time the brakes were applied, which car traveled farther until it came to a complete stop?


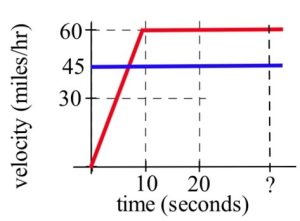
5. Police chase: A speeder traveling 45 miles per hour (in a 25 mph zone) passes a stopped police car which immediately takes off after the speeder. If the police car speeds up steadily to 60 miles/hour in 20 seconds and then travels at a steady 60 miles/hour, how long and how far before the police car catches the speeder who continued traveling at 45 miles/hour? (Fig. 5)

In problems 6 – 8 , represent the area of each bounded region as a definite integral, and use geometry to determine the value of the definite integral.
6. The region bounded by y = 4 – 2x , the x–axis, and the y–axis.
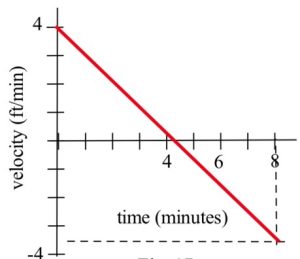
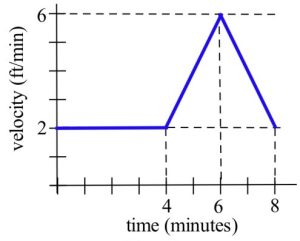
7. Your velocity along a straight road is shown in Fig. 7. How far did you travel in 8 minutes?

8. Your velocity along a straight road is shown in Fig. 8. How many feet did you walk in 8 minutes?

Media Attributions
- Fig 33.JPG
- Fig 34
- Fig 37
- Fig 39
- Fig 41
- Fig 46
- Fig 47
