Chapter 5 Sets
5.5 Set Operations with Three Sets
Learning Objectives
By the end of this section, you will be able to:
- Interpret Venn diagrams with three sets.
- Create Venn diagrams with three sets.
- Apply set operations to three sets.
- Prove equality of sets using Venn diagrams.
Have you ever searched for something on the Internet and then soon after started seeing multiple advertisements for that item while browsing other web pages? Large corporations have built their business on data collection and analysis. As we start working with larger data sets, the analysis becomes more complex. In this section, we will extend our knowledge of set relationships by including a third set.
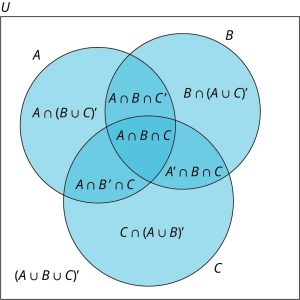
A Venn diagram with two intersecting sets breaks up the universal set into four regions; simply adding one additional set will increase the number of regions to eight, doubling the complexity of the problem.
Venn Diagrams with Three Sets
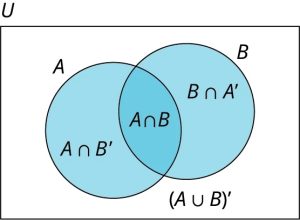
Below is a Venn diagram with two intersecting sets, which breaks the universal set up into four distinct regions.
Example 1
Use the Venn diagram below, which shows the blood types of [latex]100[/latex] people who donated blood at a local clinic, to answer the following questions.
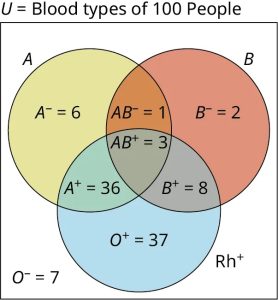
a) How many people with a type [latex]A[/latex] blood factor donated blood?
The number of people who donated blood with a type [latex]A[/latex] blood factor will include the sum of all the values included in the [latex]A[/latex] circle. It will be the union of sets [latex]A^-, A^+, AB^-[/latex], and [latex]AB^+[/latex]. [latex]n(A)=n(A^-)+n(A^+)+n(AB^-)+n(AB^+)=6+36+1+3=46[/latex].
b) Julio has blood type [latex]B^+[/latex]. If he needs to have surgery that requires a blood transfusion, he can accept blood from anyone who does not have a type [latex]A[/latex] blood factor. How many people donated blood that Julio can accept?
In part a, it was determined that the number of donors with a type [latex]A[/latex] blood factor is [latex]46[/latex]. To determine the number of people who did not have a type [latex]A[/latex] blood factor, use the following property [latex]A'[/latex]union [latex]A[/latex] is equal to [latex]U[/latex], which means [latex]n(A)+n(A')=n(U)[/latex], and [latex]n(A')=n(U)-n(A)=100-46=54[/latex]. Thus, [latex]54[/latex] people donated blood that Julio can accept.
c) How many people who donated blood do not have the [latex]Rh^+[/latex] blood factor?
This would be everyone outside the [latex]Rh^+[/latex]circle, or everyone with a negative [latex]Rh[/latex] factor, [latex]n(Rh^-)=n(O^-)+n(A^-)+n(AB^-)+n(B^-)=7+6+1+2=16[/latex].
d) How many people had type [latex]A[/latex] and type [latex]B[/latex] blood?
To have both blood type [latex]A[/latex] and blood type [latex]B[/latex], a person would need to be in the intersection of sets [latex]A[/latex] and [latex]B[/latex]. The two circles overlap in the regions labeled [latex]AB^-[/latex] and [latex]AB^+[/latex]. Add up the number of people in these two regions to get the total [latex]1+3=4[/latex]. This can be written symbolically as [latex]n(A \text{ and } B=A \cap B=n(AB^-)+n(AB^+)=1+3=4[/latex].
Exercise 1
a) How many people donated blood with a type B blood factor?
b) How many people who donated blood did not have a type B blood factor?
c) How many people who donated blood had a type B blood factor or were Rh+?
Solution
a) [latex]n(B)=n(AB^+)+n(AB^-)+n(B^+)+n(B^-)=14[/latex]
b) [latex]n(B')=n(U)-n(B)=86[/latex]
c) [latex]n(B \cup Rh^+)=87[/latex]
In general, when creating Venn diagrams from data involving three subsets of a universal set, the strategy is to work from the inside out. Start with the intersection of the three sets, then address the regions that involve the intersection of two sets. Next, complete the regions that involve a single set, and finally address the region in the universal set that does not intersect with any of the three sets. This method can be extended to any number of sets. The key is to start with the region involving the most overlap, working your way from the center out.
Example 2
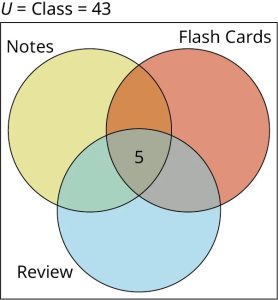
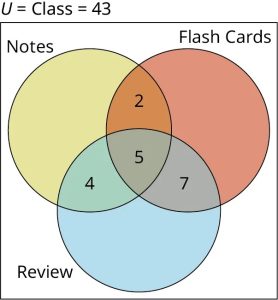
A teacher surveyed her class of [latex]43[/latex] students to find out how they prepared for their last test. She found that [latex]24[/latex] students made flash cards, [latex]14[/latex] studied their notes, and [latex]27[/latex] completed the review assignment. Of the entire class of [latex]43[/latex] students, [latex]12[/latex] completed the review and made flash cards, [latex]9[/latex] completed the review and studied their notes, and [latex]7[/latex] made flash cards and studied their notes, while only [latex]5[/latex] students completed all three of these tasks. The remaining students did not do any of these tasks. Create a Venn diagram with subsets labeled: “Notes,” “Flash Cards,” and “Review” to represent how the students prepared for the test.
Step 1: First, draw a Venn diagram with three intersecting circles to represent the three intersecting sets: Notes, Flash Cards, and Review. Label the universal set with the cardinality of the class.

Step 3: Next, calculate the value and label the three sections where just two sets overlap.
- Review and flash card overlap. A total of [latex]12[/latex] students completed the review and made flash cards, but five of these twelve students did all three tasks, so we need to subtract [latex]12-5=7[/latex]. This is the value for the region where the flash card set intersects with the review set.
- Review and notes overlap. A total of [latex]9[/latex] students completed the review and studied their notes, but again, five of these nine students completed all three tasks. So, we subtract [latex]9-5=4[/latex]. This is the value for the region where the review set intersects with the notes set.
- Flash card and notes overlap. A total of [latex]7[/latex] students made flash cards and studied their notes; subtracting the five students that did all three tasks from this number leaves [latex]2[/latex] students who only studied their notes and made flash cards. Add these values to the Venn diagram.
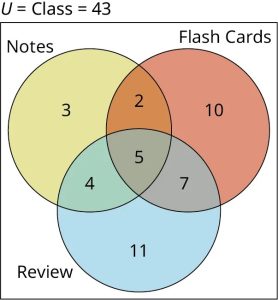
- A total of [latex]24[/latex] students completed flash cards, but we have already accounted for [latex]2+5+7=14[/latex] of these. Thus, [latex]
24 - 14 = 10 24 - 14 = 10 - A total of [latex]14[/latex] students studied their notes, but we have already accounted for [latex]4+5+2=11[/latex] of these. Thus, [latex]14-11=3[/latex] students only studied their notes.
- A total of [latex]27[/latex] students completed the review assignment, but we have already accounted for [latex]4+5+7=16[/latex] of these, which means [latex]27-16=11[/latex] students only completed the review assignment.
- Add these values to the Venn diagram.
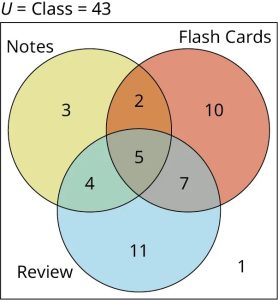
Step 5: Finally, compute how many students did not do any of these three tasks. To do this, we add together each value that we have already calculated for the separate and intersecting sections of our three sets: [latex]3+2+4+5+10+7+11=42[/latex]. Because there are [latex]43[/latex] students in the class, and [latex]43-42=1[/latex] this means only one student did not complete any of these tasks to prepare for the test. Record this value somewhere in the rectangle, but outside of all the circles, to complete the Venn diagram.
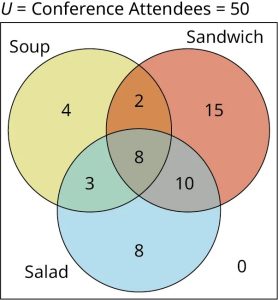
Exercise 2
Solution
Applying Set Operations to Three Sets
Set operations are applied between two sets at a time. Parentheses indicate which operation should be performed first. As with numbers, the innermost parentheses are applied first. Next, find the complement of any sets, then perform any union or intersections that remain.
Example 3
Perform the set operations as indicated on the following sets.
[latex]U=\{0, 1, 2, 3, 4, 5, 6, 7, 8, 9, 10, 11, 12\},[/latex]
[latex]A= \{0, 1, 2, 3, 4, 5, 6\},[/latex]
[latex]B=\{0, 2, 4, 6, 8, 10, 12\},[/latex]
[latex]C=\{0, 3, 6, 9, 12\}[/latex]
a) Find [latex](A \cap B)\cap C[/latex].
Parentheses first, [latex]A[/latex] intersection [latex]B[/latex] equals [latex]A \cap B=\{0, 2, 4, 6\}[/latex], the elements common to both [latex]A[/latex] and [latex]B[/latex]. [latex](A \cap B)\cap C=\{0, 2, 4, 6\} \cap \{0, 3, 6, 9, 12\}=\{0, 6\}[/latex], because the only elements that are in both sets are [latex]0[/latex] and [latex]6[/latex].
b) Find [latex]A \cap (B \cup C)[/latex].
Parentheses first, [latex]B[/latex] union [latex]C[/latex] equals [latex]B \cup C=\{0, 2, 3, 4, 6, 8, 9, 10, 12\}[/latex], the collection of all elements in set [latex]B[/latex] or set [latex]C[/latex] or both. [latex]A \cap (B \cup C)=\{0, 1, 2, 3, 4, 5, 6\}\cap\{0, 2, 3, 4, 6, 8, 9, 10, 12\}=\{0, 2, 3, 4, 6\}[/latex]because the intersection of these two sets is the set of elements that are common to both sets.
c) Find [latex](A \cap B) \cup C'[/latex].
Parentheses first, [latex]A[/latex] intersection [latex]B[/latex] equals [latex]A \cap B=\{0, 2, 4, 6\}[/latex]. Next, find [latex]C'[/latex]. The complement of set [latex]C[/latex] is the set of elements in the universal set [latex]U[/latex] that are not in set [latex]C[/latex]. [latex]C'=\{1, 2, 4, 5, 7, 8, 10, 11\}[/latex]. Finally, find [latex](A \cap B)\cup C'=\{0, 2, 4, 6\}\cup\{1, 2, 4, 5, 7, 8, 10, 11\}=\{0, 1, 2, 4, 5, 6, 7, 8, 10, 11\}[/latex].
Exercise 3
Using the same sets from Example 3, perform the set operations indicated.
a) Find [latex]A\cap(B\cap C)[/latex].
b) Find [latex](A \cap B)\cup (A\cap C)[/latex].
c) Find [latex](A\cup C')\cap(B\cup C')[/latex].
Solution
a) [latex]A\cap (B\cap C)=\{0, 1, 2, 3, 4, 5, 6\}\cap\{0, 6, 12\}=\{0, 6\}[/latex]
b) [latex](A\cap B)\cup(B \cap C)=\{0, 2, 4, 6\}\cup \{0, 6, 12\}=\{0, 2, 4, 6, 12\}[/latex]
c) [latex](A\cup C')\cap(B\cup C')=\{0, 1, 2, 3, 4, 5, 6, 7, 8, 10, 11\}\cap\{0, 1, 2, 4, 5, 6, 7, 8, 10, 11, 12\}=\{0, 1, 2, 4, 5, 6, 7, 8, 10, 11\}[/latex]
Notice that the answers to Exercise 3 are the same as those in Example 3. This is not a coincidence. The following equivalences hold true for sets:
- [latex]A\cap(B\cup C)=(A\cap B)\cap C[/latex] and [latex]A\cup(B\cup C)=(A\cup B)\cup C[/latex]. These are the associative property for set intersection and set union.
- [latex]A \cap B=B \cap A[/latex] and [latex]A\cup B=B\cup A[/latex]. These are the commutative property for set intersection and set union.
- [latex]A\cap (B\cup C)=(A\cap B)\cup(A\cap C)[/latex] and [latex]A\cup (B\cap C)=(A\cup B)\cap(A\cup C)[/latex]. These are the distributive property for sets over union and intersection, respectively.
Proving Equality of Sets Using Venn Diagrams
To prove set equality using Venn diagrams, the strategy is to draw a Venn diagram to represent each side of the equality, then look at the resulting diagrams to see if the regions under consideration are identical.
Augustus De Morgan was an English mathematician known for his contributions to set theory and logic. De Morgan’s law for set complement over union states that [latex](A \cup B)'=A' \cap B'[/latex]. In the next example, we will use Venn diagrams to prove De Morgan’s law for set complement over union is true. But before we begin, let us confirm De Morgan’s law works for a specific example. While showing something is true for one specific example is not a proof, it will provide us with some reason to believe that it may be true for all cases.
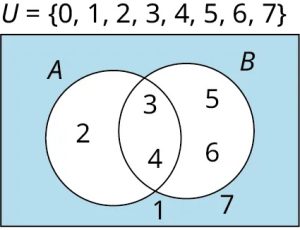
Let [latex]U=\{1, 2, 3, 4, 5, 6, 7\}, A=\{2, 3, 4\}[/latex], and [latex]B=\{3, 4, 5, 6\}[/latex]. We will use these sets in the equation [latex](A \cup B)'=A' \cap B'[/latex].
To begin, find the value of the set defined by each side of the equation.
Step 1: [latex]A\cup B[/latex] is the collection of all unique elements in set [latex]A[/latex] or set [latex]B[/latex] or both. [latex]A\cup B=\{2, 3, 4, 5, 6\}[/latex]. The complement of [latex]A[/latex] union [latex]B[/latex], [latex](A\cup B)'[/latex], is the set of all elements in the universal set that are not in [latex]A \cup B[/latex]. So, the left side the equation [latex](A \cup B)'[/latex] is equal to the set [latex]\{1, 7\}[/latex].
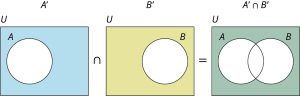
Step 2: The right side of the equation is [latex]A' \cap B'[/latex]. [latex]A'[/latex] is the set of all members of the universal set [latex]U[/latex] that are not in set [latex]A[/latex].
[latex]A'=\{1, 5, 6, 7\}[/latex]. Similarly, [latex]B'=\{1, 2, 7\}[/latex]
Step 3: Finally, [latex]A'\cap B'[/latex] is the set of all elements that are in both [latex]A'[/latex] and [latex]B'[/latex]. The numbers [latex]1[/latex] and [latex]7[/latex] are common to both sets, therefore, [latex]A' \cap B'=\{1, 7\}[/latex]. Because, [latex]\{1, 7\}=\{1, 7\}[/latex] we have demonstrated that De Morgan’s law for set complement over union works for this particular example.
The Venn diagram below depicts this relationship.
Example 4
De Morgan’s Law for the complement of the union of two sets [latex]A[/latex] and [latex]B[/latex] states that:
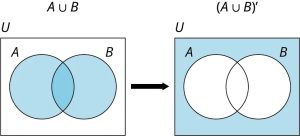
[latex](A \cup B)' = A' \cap B'[/latex]. Use a Venn diagram to prove that De Morgan’s Law is true.
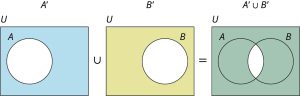
Step 1: First, draw a Venn diagram representing the left side of the equality. The regions of interest are shaded to highlight the sets of interest. [latex]A \cup B[/latex] is shaded on the left, and [latex](a\cup B)'[/latex] is shaded on the right.
Exercise 4
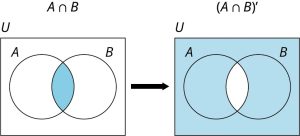
De Morgan’s Law for the complement of the intersection of two sets [latex]A[/latex] and [latex]B[/latex] states that [latex](A \cup B)' = A' \cap B'[/latex]. Use a Venn diagram to prove that De Morgan’s Law is true.
Solution
The left side of the equation is:
Media Attributions
- Figure 1.29 © OpenStax Contemporary Math is licensed under a CC BY (Attribution) license
- Three set Venn diagram © OpenStax Contemporary Math is licensed under a CC BY (Attribution) license
- Blood types of 100 people Venn diagram © OpenStax is licensed under a CC BY (Attribution) license
- Venn diagram for Step 1 © OpenStax Contemporary Math is licensed under a CC BY (Attribution) license
- Venn diagram for Step 2 © OpenStax is licensed under a CC BY (Attribution) license
- Venn diagram for step 3 © OpenStax is licensed under a CC BY (Attribution) license
- Venn diagram for step 4 © OpenStax is licensed under a CC BY (Attribution) license
- Venn diagram for step 5 © OpenStax is licensed under a CC BY (Attribution) license
- Attendees at a conference with sets: Soup, Sandwich, Salad – Complete Venn diagram Solution © OpenStax is licensed under a CC BY (Attribution) license
- Two set Venn diagram with sets A and B © OpenStax is licensed under a CC BY (Attribution) license
- Left Side of DeMorgan’s Law © OpenStax is licensed under a CC BY (Attribution) license
- Right side of the equation for DeMorgan’s Law © OpenStax is licensed under a CC BY (Attribution) license
- Venn diagram of intersection of two sets and its complement © OpenStax is licensed under a CC BY (Attribution) license
- Venn diagram of the union of the complement of two sets © OpenStax is licensed under a CC BY (Attribution) license
