Chapter 8 Statistics
8.5 Percentiles
Learning Objectives
By the end of this section, you will be able to:
- Compute percentiles.
- Solve application problems involving percentiles.
A college admissions officer is comparing two students. The first, Anna, finished 12th in her class of 235 people. The second, Brian, finished 10th in his class of 170 people. Which of these outcomes is better? Certainly 10 is less than 12, which favors Brian, but Anna’s class was much bigger. In fact, Anna beat out 223 of her classmates, which is [latex]\frac{223}{235} \approx 95\%[/latex] of her classmates, while Brian bested 160 out of 170 people, or 94%. Comparing the proportions of the data values that are below a given number can help us evaluate differences between individuals in separate populations. These proportions are called percentiles. If [latex]p\%[/latex] of the values in a dataset are less than a number [latex]n[/latex], then we say that [latex]n[/latex] is at the [latex]p\text{th}[/latex] percentile.
Finding Percentiles
There are some other terms that are related to “percentile” with meanings you may infer from their roots. Remember that the word percent means “per hundred.” This reflects that percentiles divide our data into 100 pieces. The word quartile has a root that means “four.” So, if a data value is at the first quantile of a dataset, that means that if you break the data into four parts (because of the quart-), this data value comes after the first of those four parts. In other words, it’s greater than 25% of the data, placing it at the 25th percentile. Quintile has a root meaning “five,” so a data value at the third quintile is greater than three-fifths of the data in the set. That would put it at the 60th percentile. The general term for these is quantiles (the root quant– means “number”).
In Section 8.3, we defined the median as a number that is greater than no more than half of the data in a dataset and is less than no more than half of the data in the dataset. With our new term, we can more easily define it: The median is the value at the 50th percentile (or second quartile).
Let’s look at some examples.
Example 1
Consider the dataset 5, 8, 12, 1, 2, 16, 2, 15, 20, 22.
a) At what percentile is the value 5?
Before we can answer these any questions, we must put the data in increasing order: 1, 2, 2, 5, 8, 12, 15, 16, 20, 22.
There are three values (1, 2, and 2) in the set that are less than 5, and there are ten values in the set. Thus, 5 is at the [latex]\frac{3}{10} \cdot 100 = 30\text{th}[/latex] percentile.
b) What value is at the 60th percentile?
To find the value at the 60th percentile, we note that there are ten data values, and 60% of ten is six. Thus, the number we want is greater than exactly six of the data values. Thus, the 60th percentile is 15.
Exercise 1
a) What value is at the 80th percentile?
b) At what percentile is the value 12?
Solution
a) 15
b) 70th percentile
Quartiles are special percentiles. The first quartile, [latex]Q_1[/latex], is the same as the 25th percentile, and the third quartile, [latex]Q_3[/latex], is the same as the 75th percentile. The median, [latex]M[/latex], is called both the second quartile and the 50th percentile.
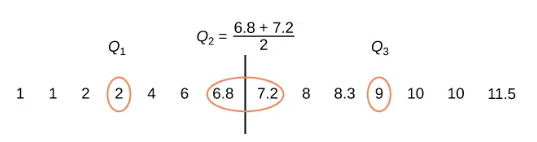
Quartiles are numbers that separate the data into quarters. Quartiles may or may not be part of the data. To find the quartiles, first find the median, or second, quartile. The first quartile, [latex]Q_1[/latex], is the middle value of the lower half of the data, and the third quartile, [latex]Q_3[/latex], is the middle value, or median, of the upper half of the data. To get the idea, consider the same data set:
1, 1, 2, 2, 4, 6, 6.8, 7.2, 8, 8.3, 9, 10, 10, 11.5
The data set has an even number of values (14 data values), so the median will be the average of the two middle values (the average of 6.8 and 7.2), which is calculated as [latex]\frac{6.8+7.2}{2}[/latex] and equals 7.
So, the median, or second quartile ([latex]Q_2[/latex]), is 7.
The first quartile is the median of the lower half of the data, so if we divide the data into seven values in the lower half and seven values in the upper half, we can see that we have an odd number of values in the lower half. Thus, the median of the lower half, or the first quartile ([latex]Q_1[/latex]) will be the middle value, or 2. Using the same procedure, we can see that the median of the upper half, or the third quartile ([latex]Q_3[/latex]) will be the middle value of the upper half, or 9.
The quartiles are illustrated below:
The interquartile range is a number that indicates the spread of the middle half, or the middle 50 percent of the data. It is the difference between the third quartile ([latex]Q_3[/latex]) and the first quartile ([latex]Q_1[/latex])
[latex]\text{IQR}=Q_3-Q_1[/latex]. The [latex]\text{IQR}[/latex] for this data set is calculated as [latex]9 - 2[/latex], or 7.
The [latex]\text{IQR}[/latex] can help to determine potential outliers. A value is suspected to be a potential outlier if it is less than [latex]1.5 \times \text{IQR}[/latex] below the first quartile or more than [latex]1.5 \times \text{IQR}[/latex] above the third quartile. Potential outliers always require further investigation.
Note: A potential outlier is a data point that is significantly different from the other data points. These special data points may be errors or some kind of abnormality, or they may be a key to understanding the data.
Example 2
For the following 13 real estate prices, calculate the IQR and determine if any prices are potential outliers. Prices are in dollars.
389,950; 230,500; 158,000; 479,000; 639,000; 114,950; 5,500,000; 387,000; 659,000; 529,000; 575,000; 488,800; 1,095,000
Order the following data from smallest to largest:
114,950; 158,000; 230,500; 387,000; 389,950; 479,000; 488,800; 529,000; 575,000; 639,000; 659,000; 1,095,000; 5,500,000
[latex]M = 488,800[/latex]
[latex]Q_1 = \frac{230,500+387,000}{2} = 308,750[/latex]
[latex]Q_3 = \frac{639,000+659,000}{2} = 649,000[/latex]
[latex]\text{IQR} = 649,000 – 308,750 = 340,250[/latex]
[latex](1.5)(\text{IQR}) = (1.5)(340,250) = 510,375[/latex]
[latex]Q_1 – (1.5)(\text{IQR}) = 308,750 – 510,375 = –201,625[/latex]
[latex]Q_3 + (1.5)(\text{IQR}) = 649,000 + 510,375 = 1,159,375[/latex]
No house price is less than –201,625. However, 5,500,000 is more than 1,159,375. Therefore, 5,500,000 is a potential outlier.
Exercise 2
The 11 salaries for recent college graduates are listed below. Calculate the IQR, and determine if any salaries are outliers. The following salaries are in dollars.
$33,000; $64,500; $28,000; $54,000; $72,000; $68,500; $69,000; $42,000; $54,000; $120,000; $40,500
Solution
[latex]\text{IQR}=28,500[/latex]
$120,000 is a potential outlier.
In the example above, you just saw the calculation of the median, first quartile, and third quartile. These three values are part of the five number summary. The other two values are the minimum value (or min) and the maximum value (or max). The five number summary is used to create a box plot.
Example 3
Fifty finite math students were asked how much sleep they get per school night (rounded to the nearest hour). The results were as follows:
| Amount of Sleep per School Night (Hours) | Frequency | Relative Frequency | Cumulative Relative Frequency |
|---|---|---|---|
| 4 | 2 | .04 | .04 |
| 5 | 5 | .10 | .14 |
| 6 | 7 | .14 | .28 |
| 7 | 12 | .24 | .52 |
| 8 | 14 | .28 | .80 |
| 9 | 7 | .14 | .94 |
| 10 | 3 | .06 | 1.00 |
a) Find the 28th percentile.
Notice the .28 in the Cumulative Relative Frequency column. Twenty-eight percent of 50 data values is 14 values. There are 14 values less than the 28th percentile. They include the two 4s, the five 5s, and the seven 6s. The 28th percentile is between the last six and the first seven. The 28th percentile is 6.5.
b) Find the median.
Look again at the Cumulative Relative Frequency column and find .52. The median is the 50th percentile or the second quartile. Fifty percent of 50 is 25. There are 25 values less than the median. They include the two 4s, the five 5s, the seven 6s, and 11 of the 7s. The median or 50th percentile is between the 25th, or seven, and 26th, or seven, values. The median is seven.
c) Find the third quartile.
The third quartile is the same as the 75th percentile. You can eyeball this answer. If you look at the Cumulative Relative Frequency column, you find .52 and .80. When you have all the fours, fives, sixes, and sevens, you have 52 percent of the data. When you include all the 8s, you have 80 percent of the data. The 75th percentile, then, must be an eight.
Another way to look at the problem is to find 75 percent of 50, which is 37.5, and round up to 38. The third quartile, Q3, is the 38th value, which is an eight. You can check this answer by counting the values. There are 37 values below the third quartile and 12 values above.
Exercise 3
Fifty finite math students were asked how much sleep they get per school night (rounded to the nearest hour). The results were as follows:
| Amount of Sleep per School Night (Hours) | Frequency | Relative Frequency | Cumulative Relative Frequency |
|---|---|---|---|
| 4 | 2 | .04 | .04 |
| 5 | 5 | .10 | .14 |
| 6 | 7 | .14 | .28 |
| 7 | 12 | .24 | .52 |
| 8 | 14 | .28 | .80 |
| 9 | 7 | .14 | .94 |
| 10 | 3 | .06 | 1.00 |
a) Find the 80th percentile.
b) Find the 90th percentile.
c) Find the first quartile.
Solution
a) 8.5
b) 9
c) 6
A Formula for Finding the [latex]k^{th}[/latex] Percentile
If you were to do a little research, you would find several formulas for calculating the [latex]k^{th}[/latex] percentile. Here is one of them.
[latex]k = \text{the } k^{th} \text{ percentile. It may or may not be part of the data.}[/latex]
[latex]i = \text{the index (ranking or position of a data value)}[/latex]
[latex]n = \text{the total number of data}[/latex]
- Order the data from smallest to largest.
- Calculate [latex]i=\frac{k}{100}(n+1)[/latex].
- If [latex]i[/latex] is an integer, then the [latex]k^{th}[/latex] percentile is the data value in the [latex]i^{th}[/latex] position in the ordered set of data.
- If [latex]i[/latex] is not an integer, then round [latex]i[/latex] up and round [latex]i[/latex] down to the nearest integers. Average the two data values in these two positions in the ordered data set. The formula and calculation are easier to understand in an example.
Example 4
Listed are 29 ages for Academy Award-winning best actors in order from smallest to largest:
18, 21, 22, 25, 26, 27, 29, 30, 31, 33, 36, 37, 41, 42, 47, 52, 55, 57, 58, 62, 64, 67, 69, 71, 72, 73, 74, 76, 77
a) Find the 70th percentile.
- [latex]k = 70[/latex]
- [latex]i = \text{the index}[/latex]
- [latex]n = 29[/latex]
[latex]i = \frac{k}{100}(n + 1) = (\frac{70}{100})(29 + 1) = 21[/latex], which is an integer. The age in the 21st position is 64, so the 70th percentile is 64 years.
b) Find the 83rd percentile.
- [latex]k = 83[/latex]
- [latex]i = \text{the index}[/latex]
- [latex]n = 29[/latex]
[latex]i = \frac{k}{100}(n + 1) = (\frac{83}{100})(29 + 1) = 24.9[/latex], which is not an integer. Round it down to 24 and up to 25. The age in the 24th position is 71, and the age in the 25th position is 72. Average 71 and 72. The 83rd percentile is 71.5 years.
Exercise 4
Listed are 29 ages for Academy Award-winning best actors in order from smallest to largest:
18, 21, 22, 25, 26, 27, 29, 30, 31, 33, 36, 37, 41, 42, 47, 52, 55, 57, 58, 62, 64, 67, 69, 71, 72, 73, 74, 76, 77
Calculate the following.
a) the 20th percentile
b) the 55th percentile.
Solution
a) 27
b) 53.5
A Formula for Finding the Percentile of a Value in a Data Set
- Order the data from smallest to largest.
- [latex]x =[/latex] the number of data values counting from the bottom of the data list up to but not including the data value for which you want to find the percentile.
- [latex]y =[/latex]the number of data values equal to the data value for which you want to find the percentile.
- [latex]n =[/latex] the total number of data.
- Calculate [latex]\frac{x+.5y}{n}(100)[/latex]. Then round to the nearest integer.
Example 5
Listed are 29 ages for Academy Award-winning best actors in order from smallest to largest:
18, 21, 22, 25, 26, 27, 29, 30, 31, 33, 36, 37, 41, 42, 47, 52, 55, 57, 58, 62, 64, 67, 69, 71, 72, 73, 74, 76, 77
a) Find the percentile for 58.
Counting from the bottom of the list, there are 18 data values less than 58. There is one value of 58.
[latex]x = 18[/latex] and [latex]y=1[/latex].
[latex]\frac{x+.5y}{n}(100)=\frac{18+.5(1)}{29}(100)= 63.80[/latex]. Fifty-eight is the 64th percentile.
b) Find the percentile for 25.
Counting from the bottom of the list, there are three data values less than 25. There is one value of 25.
[latex]x = 3[/latex] and [latex]y = 1[/latex].
[latex]\frac{x+.5y}{n}(100)=\frac{3+.5(1)}{29}(100)= 12.07[/latex]. Twenty-five is the 12th percentile.
Exercise 5
Listed are 30 ages for Academy Award-winning best actors in order from smallest to largest:
18, 21, 22, 25, 26, 27, 29, 30, 31, 31, 33, 36, 37, 41, 42, 47, 52, 55, 57, 58, 62, 64, 67, 69, 71, 72, 73, 74, 76, 77
Find the percentiles for 47 and 31.
Solution
47 is the 52nd percentile. 31 is the 30th percentile.
Interpreting Percentiles, Quartiles, and Median
A percentile indicates the relative standing of a data value when data are sorted into numerical order from smallest to largest. Percentages of data values are less than or equal to the [latex]p^{th}[/latex] percentile. For example, 15 percent of data values are less than or equal to the 15th percentile.
- Low percentiles always correspond to lower data values.
- High percentiles always correspond to higher data values.
A percentile may or may not correspond to a value judgment about whether it is good or bad. The interpretation of whether a certain percentile is good or bad depends on the context of the situation to which the data apply. In some situations, a low percentile would be considered good; in other contexts a high percentile might be considered good. In many situations, there is no value judgment that applies. A high percentile on a standardized test is considered good, while a lower percentile on body mass index might be considered good. A percentile associated with a person’s height doesn’t carry any value judgment.
Understanding how to interpret percentiles properly is important not only when describing data, but also when calculating probabilities in later chapters of this text.
Guideline
When writing the interpretation of a percentile in the context of the given data, make sure the sentence contains the following information:
- Information about the context of the situation being considered
- The data value (value of the variable) that represents the percentile
- The percentage of individuals or items with data values below the percentile
- The percentage of individuals or items with data values above the percentile
Example 6
On a timed math test, the first quartile for the time it took to finish the exam was 35 minutes. Interpret the first quartile in the context of this situation.
- Twenty-five percent of students finished the exam in 35 minutes or less.
- Seventy-five percent of students finished the exam in 35 minutes or more.
- A low percentile could be considered good, as finishing more quickly on a timed exam is desirable. If you take too long, you might not be able to finish.
Exercise 6
At a college, it was found that the 30th percentile of number of hours that students spend studying per week is seven hours. Interpret the 30th percentile in the context of this situation.
Solution
- Thirty percent of students study seven or fewer hours per week.
- Seventy percent of students study seven or more hours per week.
- In this example, there is not necessarily a good or bad value judgment associated with a higher or lower percentile, since the time a student studies per week is dependent on his/her needs.
Example 7
A middle school is applying for a grant that will be used to add fitness equipment to the gym. The principal surveyed 15 anonymous students to determine how many minutes a day the students spend exercising. The results from the 15 anonymous students are shown:
0 minutes, 40 minutes, 60 minutes, 30 minutes, 60 minutes,
10 minutes, 45 minutes, 30 minutes, 300 minutes, 90 minutes,
30 minutes, 120 minutes, 60 minutes, 0 minutes, 20 minutes
Find the five values that make up the five number summary.
[latex]Min = 0[/latex]
[latex]Q_1 = 20[/latex]
[latex]Med = 40[/latex]
[latex]Q_3 = 60[/latex]
[latex]Max = 300[/latex]
Listing the data in ascending order gives the following:
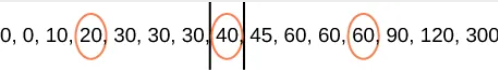
The minimum value is 0.
The maximum value is 300.
Since there are an odd number of data values, the median is the middle value of this data set as it is arranged in ascending order, or 40.
The first quartile is the median of the lower half of the scores and does not include the median. The lower half has seven data values; the median of the lower half will equal the middle value of the lower half, or 20.
The third quartile is the median of the upper half of the scores and does not include the median. The upper half also has seven data values; so the median of the upper half will equal the middle value of the upper half, or 60.
If you were the principal, would you be justified in purchasing new fitness equipment? Since 75 percent of the students exercise for 60 minutes or less daily, and since the [latex]\text{IQR}[/latex] is 40 minutes ([latex]60 – 20 = 40[/latex]), we know that half of the students surveyed exercise between 20 minutes and 60 minutes daily. This seems a reasonable amount of time spent exercising, so the principal would be justified in purchasing the new equipment.
However, the principal needs to be careful. The value 300 appears to be a potential outlier.
[latex]Q_3 + 1.5(\text{IQR}) = 60 + (1.5)(40) = 120[/latex].
The value 300 is greater than 120, so it is a potential outlier. If we delete it and calculate the five values, we get the following values:
- [latex]Min = 0[/latex]
- [latex]Q_1 = 20[/latex]
- [latex]Q_3 = 60[/latex]
- [latex]Max = 120[/latex]
We still have 75 percent of the students exercising for 60 minutes or less daily and half of the students exercising between 20 and 60 minutes a day. However, 15 students is a small sample, and the principal should survey more students to be sure of his survey results.
Media Attributions
- 8.5 01 © OpenStax Statistics is licensed under a CC BY (Attribution) license
- 8.5 02 © OpenStax Statistics is licensed under a CC BY (Attribution) license
