114 Mendel’s Experiments and the Laws of Probability
Learning Objectives
By the end of this section, you will be able to do the following:
- Describe the scientific reasons for the success of Mendel’s experimental work
- Describe the expected outcomes of monohybrid crosses involving dominant and recessive alleles
- Apply the sum and product rules to calculate probabilities
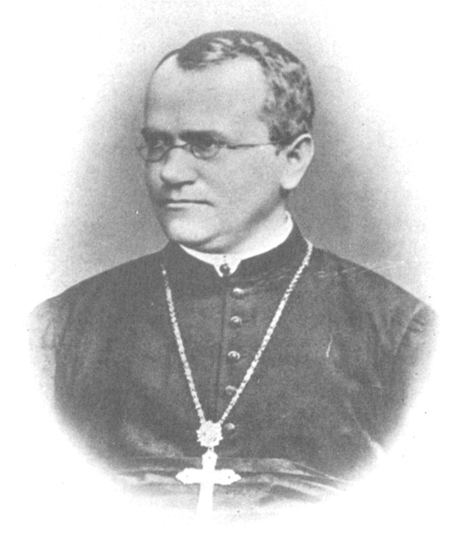
Johann Gregor Mendel (1822–1884) (Figure 12.2) was a lifelong learner, teacher, scientist, and man of faith. As a young adult, he joined the Augustinian Abbey of St. Thomas in Brno in what is now the Czech Republic. Supported by the monastery, he taught physics, botany, and natural science courses at the secondary and university levels. In 1856, he began a decade-long research pursuit involving inheritance patterns in honeybees and plants, ultimately settling on pea plants as his primary model system. In 1865, Mendel presented the results of his experiments with nearly 30,000 pea plants to the local Natural History Society. He demonstrated that traits are transmitted from parents to offspring independently of other traits and in dominant and recessive patterns. In 1866, he published his work Experiments in Plant Hybridization1 in the proceedings of the Natural History Society of Brünn.
Mendel’s work went virtually unnoticed by the scientific community, which believed, incorrectly, that the process of inheritance involved a blending of parental traits that produced an intermediate physical appearance in offspring. The blending theory of inheritance asserted that the original parental traits were lost or absorbed by the blending in the offspring, but we now know that this is not the case. The long-held belief was the “blending” hypothesis in which genetic material contributed by the two parents mixes to literally form a blend, giving rise to uniformity in a population after several mating generations, in contrast to Mendel’s “particulate” hypothesis of inheritance, the real gene idea of parents passing discrete heritable genes that retain their separate original identities in offspring and are randomly inherited and can appear as traits or remain discrete in generations where the traits are skipped.
Another complicating observation in genetics is that traits can fall in the category of discontinuous traits or continuous traits. Discontinuous traits are of the “one or the other” type. For example, the peas of a pea plant are either green or yellow. Another example is the color of the flower in the pea plant. It is either violet or it is white. Now, it can be more complicated if a trait is a continuous trait. Continuous traits are of the “range of” phenotypes. An example could be the range of height in adult humans. Some are 4 feet (ft), some are 4 feet 1 inch (in), 4 ft 2 in, 4 ft 3 in, 5ft 9 in, 6ft 4 in, and so on. Studying the underlying genetics by looking at phenotypes of continuous traits is more complicated. Mendel chose to look at the less complicated discontinuous traits and tried to understand the underlying genetics. Mendel worked with traits that were inherited as discontinuous (specifically, violet versus white flowers). Mendel’s choice of these kinds of traits allowed him to see experimentally that the traits were not blended in the offspring, nor were they absorbed; rather, they kept their distinctness and could be passed on. In 1868, Mendel became abbot of the monastery and exchanged his scientific pursuits for his pastoral duties. He was not recognized for his extraordinary scientific contributions during his lifetime. In fact, it was not until 1900 that his work was rediscovered, reproduced, and revitalized by scientists on the brink of discovering the chromosomal basis of heredity.
Mendel’s Model System
Mendelian Crosses
Mendel performed hybridizations, which involve mating two true-breeding individuals that have different traits. In the pea, which is naturally self-pollinating, this is done by manually transferring pollen from the anther of a mature pea plant of one variety to the stigma of a separate mature pea plant of the second variety. In plants, pollen carries the male gametes (sperm) to the stigma, a sticky organ that traps pollen and allows the sperm to move down the pistil to the female gametes (ova) below. To prevent the pea plant that was receiving pollen from self-fertilizing and confounding his results, Mendel painstakingly removed all of the anthers from the plant’s flowers before they had a chance to mature.
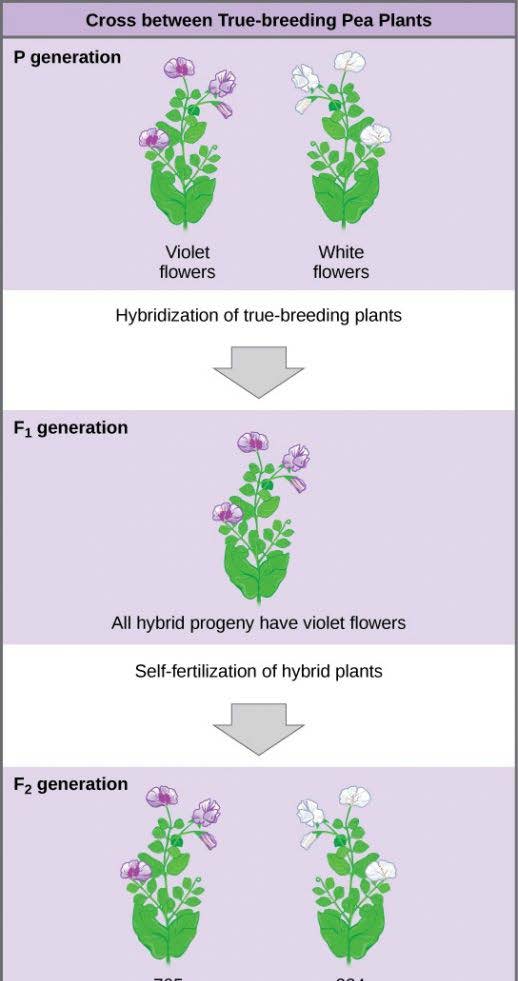
Plants used in first-generation crosses were called P0, or parental generation one (Figure 12.3). After each cross, Mendel collected the seeds belonging to the P0 plants and grew them the following season. These offspring were called the F1, or the first filial (filial = offspring, daughter or son) generation. Once Mendel examined the characteristics in the F1 generation of plants, he allowed them to self-fertilize naturally. He then collected and grew the seeds from the F1 plants to produce the F2, or second filial, generation. Mendel’s experiments extended beyond the F2 generation to the F3 and F4 generations, and so on, but it was the ratio of characteristics in the P0−F1−F2 generations that were the most intriguing and became the basis for Mendel’s postulates.
Garden Pea Characteristics Revealed the Basics of Heredity
In his 1865 publication, Mendel reported the results of his crosses involving seven different characteristics, each with two contrasting traits. A trait is defined as a variation in the physical appearance of a heritable characteristic. The characteristics included plant height, seed texture, seed color, flower color, pea pod size, pea pod color, and flower position. For the characteristic of flower color, for example, the two contrasting traits were white versus violet. To fully examine each characteristic, Mendel generated large numbers of F1 and F2 plants, reporting results from 19,959 F2 plants alone. His findings were consistent. What results did Mendel find in his crosses for flower color? First, Mendel confirmed that he had plants that bred true for white or violet flower color. Regardless of how many generations Mendel examined, all self-crossed offspring of parents with white flowers had white flowers, and all self-crossed offspring of parents with violet flowers had violet flowers. In addition, Mendel confirmed that, other than flower color, the pea plants were physically identical.
Once these validations were complete, Mendel applied the pollen from a plant with violet flowers to the stigma of a plant with white flowers. After gathering and sowing the seeds that resulted from this cross, Mendel found that 100 percent of the F1 hybrid generation had violet flowers. Mendel’s results demonstrated that the white flower trait in the F1 generation had completely disappeared. Thereby, he disproved the conventional wisdom at that time of the blending theory which would have predicted the hybrid flowers to be pale violet or for hybrid plants to have equal numbers of white and violet flowers.
Importantly, Mendel did not stop his experimentation there. He discovered that the white flower trait re-appeared. He allowed the F1 plants to self-fertilize and found that, of F2-generation plants, 705 had violet flowers and 224 had white flowers. This was a ratio of 3.15 violet flowers per one white flower, or approximately 3:1. The reappearance of white flowers is important, as it hinted at something called recessive traits (see further explanation later in this paragraph). When Mendel transferred pollen from a plant with violet flowers to the stigma of a plant with white flowers and vice versa, he obtained about the same ratio regardless of which parent, male or female, contributed which trait. This is called a reciprocal cross — a paired cross in which the respective traits of the male and female in one cross become the respective traits of the female and male in the other cross. For the other six characteristics Mendel examined, the F1 and F2 generations behaved in the same way as they had for flower color. One of the two traits would disappear or recede completely from the F1 generation only to reappear in the F2 generation at a ratio of approximately 3:1 (Table 12.1).
The Results of Mendel’s Garden Pea Hybridizations
| Characteristic | Contrasting P0 Traits | F1 Offspring Traits | F2 Offspring Traits | F2 Trait Ratios |
|---|---|---|---|---|
| Flower color | Violet vs. white | 100 percent violet |
|
3.15:1 |
| Flower position | Axial vs. terminal | 100 percent axial |
|
3.14:1 |
| Plant height | Tall vs. dwarf | 100 percent tall |
|
2.84:1 |
| Seed texture | Round vs. wrinkled | 100 percent round |
|
2.96:1 |
| Seed color | Yellow vs. green | 100 percent yellow |
|
3.01:1 |
| Pea pod texture | Inflated vs. constricted | 100 percent inflated |
|
2.95:1 |
| Pea pod color | Green vs. yellow | 100 percent green |
|
2.82:1 |
Upon compiling his results for many thousands of plants, Mendel concluded that the characteristics could be divided into expressed and latent traits. He called these, respectively, dominant and recessive traits. Dominant traits are those that are inherited unchanged in a hybridization. Recessive traits become latent, or disappear, in the offspring of a hybridization. The recessive trait does, however, reappear in the progeny of the hybrid offspring. An example of a dominant trait is the violet-flower trait. For this same characteristic (flower color), white-colored flowers are a recessive trait. The fact that the recessive trait reappeared in the F2 generation meant that the traits remained separate (not blended) in the plants of the F1 generation. Mendel also proposed that plants possessed two copies of the trait for the flower-color characteristic, and that each parent transmitted one of its two copies to its offspring, where they came together. Moreover, the physical observation of a dominant trait could mean that the genetic composition of the organism included two dominant versions of the characteristic or that it included one dominant and one recessive version. Conversely, the observation of a recessive trait meant that the organism lacked any dominant versions of this characteristic.
So why did Mendel repeatedly obtain 3:1 ratios in his crosses? To understand how Mendel deduced the basic mechanisms of inheritance that lead to such ratios, we must first review the laws of probability.
Probability Basics
Probabilities are mathematical measures of likelihood. The empirical probability of an event is calculated by dividing the number of times the event occurs by the total number of opportunities for the event to occur. It is also possible to calculate theoretical probabilities by dividing the number of times that an event is expected to occur by the number of times that it could occur. Empirical probabilities come from observations, like those of Mendel. Theoretical probabilities, on the other hand, come from knowing how the events are produced and assuming that the probabilities of individual outcomes are equal. A probability of one for some event indicates that it is guaranteed to occur, whereas a probability of zero indicates that it is guaranteed not to occur. An example of a genetic event is a round seed produced by a pea plant.
In one experiment, Mendel demonstrated that the probability of the event “round seed” occurring was one in the F1 offspring of true-breeding parents, one of which has round seeds and one of which has wrinkled seeds. When the F1 plants were subsequently self-crossed, the probability of any given F2 offspring having round seeds was now three out of four. In other words, in a large population of F2 offspring chosen at random, 75 percent were expected to have round seeds, whereas 25 percent were expected to have wrinkled seeds. Using large numbers of crosses, Mendel was able to calculate probabilities and use these to predict the outcomes of other crosses.
The Product Rule and Sum Rule
The product rule of probability can be applied to this phenomenon of the independent transmission of characteristics. The product rule states that the probability of two independent events occurring together can be calculated by multiplying the individual probabilities of each event occurring alone. To demonstrate the product rule, imagine that you are rolling a six-sided die (D) and flipping a penny (P) at the same time. The die may roll any number from 1–6 (D#), whereas the penny may turn up heads (PH) or tails (PT). The outcome of rolling the die has no effect on the outcome of flipping the penny and vice versa. There are 12 possible outcomes of this action (Table 12.2), and each event is expected to occur with equal probability.
| Rolling Die | Flipping Penny |
|---|---|
| D1 | PH |
| D1 | PT |
| D2 | PH |
| D2 | PT |
| D3 | PH |
| D3 | PT |
| D4 | PH |
| D4 | PT |
| D5 | PH |
| D5 | PT |
| D6 | PH |
| D6 | PT |
Of the 12 possible outcomes, the die has a 2/12 (or 1/6) probability of rolling a two, and the penny has a 6/12 (or 1/2) probability of coming up heads. By the product rule, the probability that you will obtain the combined outcome 2 and heads is: (D2) x (PH) = (1/6) x (1/2) or 1/12 (Table 12.3). Notice the word “and” in the description of the probability. The “and” is a signal to apply the product rule. For example, consider how the product rule is applied to the dihybrid cross: the probability of having both dominant traits (using for example the traits for seed, yellow and round) in the F2 progeny is the product of the probabilities of having the dominant trait for each characteristic, as shown here:
3/4×3/4=9/16
On the other hand, the sum rule of probability is applied when considering two mutually exclusive outcomes that can come about by more than one pathway. The sum rule states that the probability of the occurrence of one event or the other event, of two mutually exclusive events, is the sum of their individual probabilities. Notice the word “or” in the description of the probability. The “or” indicates that you should apply the sum rule. In this case, let’s imagine you are flipping a penny (P) and a quarter (Q). What is the probability of one coin coming up heads and one coin coming up tails? This outcome can be achieved by two cases: the penny may be heads (PH) and the quarter may be tails (QT), or the quarter may be heads (QH) and the penny may be tails (PT). Either case fulfills the outcome. By the sum rule, we calculate the probability of obtaining one head and one tail as [(PH) × (QT)] + [(QH) × (PT)] = [(1/2) × (1/2)] + [(1/2) × (1/2)] = 1/2. You should also notice that we used the product rule to calculate the probability of PH and QT, and also the probability of PT and QH, before we summed them. Again, the sum rule can be applied to show the probability of having at least one dominant trait in the F2 generation of a dihybrid cross:
(1/4×3/4)+(3/4×1/4)=3/16+3/16=6/16=3/8
The major differences of the “product rule” and the “sum rule” are summarized in (Table 12.3).
The Product Rule and Sum Rule
| Product Rule | Sum Rule |
|---|---|
| For independent events A and B, the probability (P) of them both occurring (A and B) is (PA × PB) | For mutually exclusive events A and B, the probability (P) that at least one occurs (A or B) is (PA + PB) |
To use probability laws in practice, we must work with large sample sizes because small sample sizes are prone to deviations caused by chance. The large quantities of pea plants that Mendel examined allowed him to calculate the probabilities of the traits appearing in his F2 generation. As you will learn, this discovery meant that when parental traits were known, the offspring’s traits could be predicted accurately even before fertilization.
Footnotes
- 1 Johann Gregor Mendel, Versuche über Pflanzenhybriden Verhandlungen des naturforschenden Vereines in Brünn, Bd. IV für das Jahr, 1865 Abhandlungen, 3–47. [for English translation see http://www.mendelweb.org/Mendel.plain.html]
