Macromolecules in Common Food
Learning Objectives
After completing the lab, the student will be able to:
- Detect the presence of macromolecules.
- Explain how the macromolecules found in a particular food provide evidence about their energy resources.
Pre-Assessment
- A chemical indicator called Benedict’s solution turns from blue to brick red in the presence of certain monosaccharides. Would you expect it to turn red in the presence of glucose? Of sucrose?
- A chemical mixture containing copper sulfate undergoes a color change when it binds to the nitrogen atoms in certain macromolecules. What types of macromolecules can be detected using this solution?
- Discuss the answers to questions 1 and 2 with the class.
Detecting Reducing Sugars, Starch, Proteins, and Lipids
The three major macromolecules that make up the bulk of our foods are carbohydrates, lipids, and proteins. Carbohydrates and proteins often consist of many smaller structural units, called monomers, linked together into long chains, called polymers. Before investigating the presence of these macromolecules in food, it is important to first perform what is called a positive control and negative control standards test for each macromolecule. Your positive control samples will contain the macromolecules glucose, starch, egg white protein, and vegetable oil. These samples will provide you with a reference for identifying each of the representative macromolecules in your food samples. Your negative control will be distilled water, which should provide results for the absence of the macromolecule in your food sample.
To begin your investigation, you will conduct a sequence of four tests for investigating macromolecules. In test 1, you will use a procedure called the Benedict’s test to confirm the presence of glucose, which is a monosaccharide found in many types of food. For test 2, you will use a solution of iodine to determine whether the polysaccharide starch is present in a solution. For test 3, you will use the Biuret test to identify if a solution contains protein. Then, in test 4, lipids will be detected using a very simple test called the paper spot test.
For this activity, you will work in pairs.
To expedite the lab activity, one team member should carry out the carbohydrates (glucose and starch) activities while the other team member does the tests on the lipids and the proteins.
Safety Precautions
- Safety goggles must be used throughout the duration of the laboratory activity.
- It is highly recommended that you wear rubber gloves and a lab apron when handling any of the chemicals.
- Immediately inform your teacher of spills containing the test solutions. The acids and bases in the solutions can harm your skin.
- Immediately inform your teacher of any broken glassware, as it could cause injuries.
- Clean up any spilled water or other fluids to prevent other people from slipping.
- Immediately wash your hands if they directly come in contact with the test solutions. It is important to wash your hands after the laboratory activity to avoid any possible contamination of other surfaces with chemical residues that might be on your hands.
For this activity, you will need the following:
- Eight test tubes (one test tube per sample being tested)
- 10 ml graduated cylinder
- Grease pencil or washable marker
- One test tube rack
- One test tube holder
- Eight sample droppers or pipettes (do not mix pipettes from one solution to another)
- One thermometer
- Hot plate or microwave
- 250 ml beaker
- Brown paper bag
- Scissors
- Small ruler
- Hair dryer or lamp
Chemicals
- Distilled water
- Benedict’s solution
- 1 percent copper sulfate solution or Biuret reagent
- 10 percent sodium hydroxide
- Lugol’s solution or iodine-potassium iodide solution
- 5 percent glucose solution
- 2 percent starch solution
- 1 percent albumin solution or raw liquid egg white
- Vegetable oil
- A selection of common foods (contrasting in their reputation of healthiness)
Structured Inquiry
Calibrating the test tubes:
Before beginning this activity, it is important to calibrate (mark increments of measurement upon) your test tubes to ensure accurate and consistent test results. To do this, you will need the test tube rack, seven test tubes, the 10 ml graduated cylinder, and a marker or grease pencil. For this laboratory activity, it is best to calibrate your test tubes in 1 ml increments. The maximum volume you will measure is 5 ml.
Step 1: Collect eight test tubes, a test tube rack, the grease pencil or marker, and a 10 ml graduated cylinder.
Step 2: Write out a procedure for calibrating your eight test tubes.
Step 3: Get your procedure approved by your teacher before you continue with the calibration.
Step 4: Use the grease pencil or marker provided by your teacher to draw the calibration lines.
Step 5: Explain how estimating the quantities of a solution in an uncalibrated test tube could affect the results of an experiment. Record your answers in your laboratory notebook.
Carbohydrates:
As mentioned earlier, you will test for glucose and starch. In this investigation, explain which samples are the negative controls and which are the positive controls.
Use the following steps to test for the presence of glucose and starch.
Step 1: Place four clean test tubes in the test tube rack and use the grease pencil or marker to number each test tube as shown here.
|
Test tube number |
1 |
2 |
3 |
4 |
|
Test solution |
Distilled water |
Glucose test solution |
Distilled water |
Starch test solution |
Table 3.1
Step 2: Hypothesis/Predict: Predict which of the tubes will show a positive result for the Benedict’s test and which will show a negative result. Write your prediction in a table for recording the data from the tests.
Step 3: Which tubes represent the positive and negative controls for this experiment? Explain why in your notebook.
Step 4: Add approximately 150 ml of water into the 250 ml beaker. Use the hot plate or microwave to heat the water to about 80oC.
Step 5: Add 1 ml of distilled water to test tube 1. Then add 1 ml of the 5 percent glucose solution to test tube 2.
Step 6: Observe the appearance of each solution and record your observations in your table.
Step 7: Add 2 ml of the Benedict’s solution to test tube 1 and to test tube 2. Observe the color of each solution and record your observations in your table.
Step 8: Place test tubes 1 and 2 in the beaker of heated water for 5 minutes. If using a hot plate, turn off the heat after removing the test tubes.
Step 9: Use a test tube holder to remove test tubes 1 and 2 and allow them to cool in the test tube rack. Observe the color of each solution and record your observations in your data table.
Step 10: Add 1 ml of distilled water to test tube 3. This will be your negative control standard for the starch test.
Step 11: Add 1 ml of the 2 percent starch solution to test tube 4. This will be your positive control standard.
Step 12: Observe the appearance of each solution and record your observations in your data table.
Step 13: Add 8 drops of the Lugol’s solution or potassium iodide solution to test tube 3 and to test tube 4. Observe the color of each solution and record your observations in your data table. It may be useful to take photographs of your results.
Step 14: Cleanup:
- Empty test tubes 1 and 2 into a container designated for copper wastes or hazardous wastes.
- Empty test tubes 3 and 4 into a container designated for iodine wastes or hazardous wastes.
- Rinse out all of the test tubes with soap and water. Make sure to rinse out all of the soap from the test tubes.
- Dispose of the water from the 250 ml beaker into a sink only after it has cooled.
- Place the test tubes upside down in a test tube rack to dry.
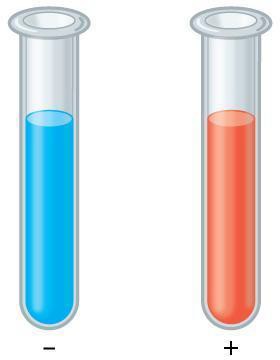
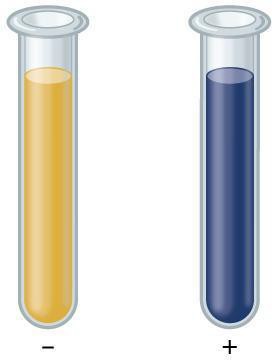
Step 15: Critical Analysis: Discuss with your partner if your results match the expected results shown in Figure 3.1 and Figure 3.2. If your result did not match those in these figures, what could be some reasons for your results not matching?
Proteins:
Step 1: Place three clean test tubes in the test tube rack and use the grease pencil or marker to number each test tube as shown here.
|
Test tube number |
1 |
2 |
3 |
|
Test solution |
Distilled water |
Dilute protein solution |
Concentrated protein solution |
Table 3.2
Step 2: Hypothesis/Predict: Predict which of the tubes will show a positive result for the Biuret test and which will show a negative result. Write your prediction in a table for recording the data from the tests. Which tubes represent the positive and negative controls for this experiment? Explain why in your notebook
Step 3: Add 2 ml of distilled water to test tube 1. Then add 1 ml of distilled water and 1 ml of the 1 percent albumin solution or raw egg white to test tube 2.
Step 4. Add 2 ml of 1 percent albumin solution or raw egg white to test tube 3.
Step 5: Observe the appearance of each solution and record your observations in your data table.
Step 6: Add 2 ml of the 10 percent sodium hydroxide to each test tube and carefully swirl the tubes to mix the solution.
Step 7: Add five drops of the 1 percent copper sulfate solution or Biuret reagent to each test tube. Carefully swirl the tubes to mix the solution.
Step 8: Observe the color of each solution and record your observations in your data table. It may be useful to take photographs of your results.
Step 9: Cleanup:
- Empty all test tubes into a container designated for copper wastes or hazardous wastes.
- Rinse out all of the test tubes with soap and water. Make sure to rinse out all of the soap from the test tubes.
- Place the test tubes upside down in a test tube rack to dry.
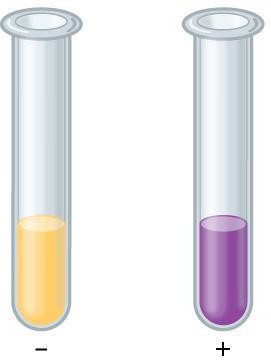
Step 10: Discuss with your partner whether your results match the expected results shown in Figure 3.3. Does the color of the positive test more closely match your 50% albumin sample, or your 100% albumin? Why do you think? Record your answers in your laboratory notebook.
Lipids:
As discussed in the introduction, you will use a strip of brown paper to indicate the presence of lipids in a solution.
In this investigation, explain which samples are the negative controls and which are the positive controls. Why is it important to perform a negative control and a positive control before using these tests to analyze foods for lipids? Write your answers in your laboratory notebook.
Use the following steps to test for the presence of lipids.
Step 1: Design a table for recording the data from the lipid test. You should show your table to the teacher before proceeding with the activity.
Step 2: Place 3 clean test tubes in the test tube rack and use the grease pencil or marker to number each test tube as shown here.
|
Test tube number |
1 |
2 |
3 |
|
Test solution |
Distilled water |
Water mixed with vegetable oil |
Vegetable oil |
Table 3.3
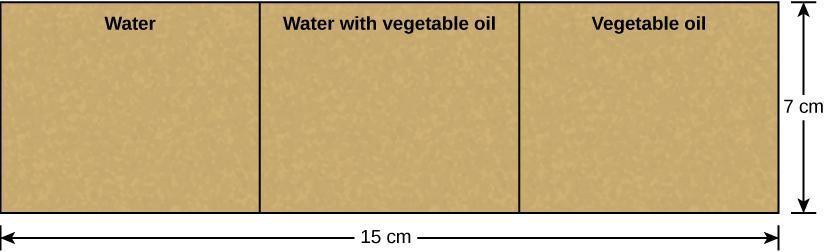
Step 3: Use the scissors to cut a piece of the brown paper bag into a 7 cm × 15 cm rectangle. At each 5 cm interval along the long side of this rectangle, draw a line using the grease pencil so that you have three equal boxes. Label the cut sections of the bag according to Figure 3.4.
Step 4: Add 1 ml of distilled water to test tube 1.
Step 5: Add 1 ml of distilled water and 1 ml of vegetable oil to test tube 2.
Step 6: Add 1 ml of vegetable oil to test tube 3.
Step 7: Use a pipette to collect the distilled water from test tube 1. Transfer the liquid to the brown paper bag. Add enough of the liquid to make a spot 1 cm in diameter on the section of the brown paper bag labeled Water.
Step 8: Gently swirl test tube number two until the solution is uniform. Quickly, use a pipette to collect the solution.
Step 9: Add enough of the liquid to make a spot 1 cm in diameter on the section of the brown paper bag labeled Water mixed with vegetable oil.
Step 10: Use a pipette to collect the vegetable oil from test tube 3. Transfer the liquid to the brown paper bag. Add enough of the liquid to make a spot 1 cm in diameter on the section of the brown paper bag labeled Vegetable oil.
Step 11: Record your results in your table. It may be useful to take photographs of your results.
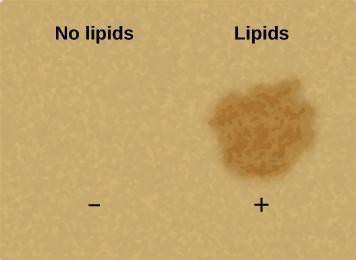
Step 12: Critical Analysis: Discuss with your partner whether your results match the expected results shown below in Figure 3.5. Does the positive test result for lipids look more like your 50% oil or 100% oil result? Why do you think? Record your answers in your laboratory notebook.
Guided Inquiry
Step 1: Hypothesize/Predict: Explain the types of nutrient macromolecules you would expect to find in food grouping 1. Do the same assessment for food grouping 2. Write your ideas in your laboratory notebook.
Step 2: Student-Led Planning: Write out the steps you will need to analyze the macromolecule content of the foods. Select only one food from each grouping. Remember to keep in mind how you will work safely in the lab and how you will dispose of the lab wastes. Submit your experimental procedure to your teacher. Once your teacher approves of your procedure, perform your experiment and record your data in an appropriate format. Write your results in your laboratory notebook.
Step 3: Critical Analysis: Which of the foods had the best balance of different macromolecules?
Assessments
- A student needs to calibrate an unmarked beaker in order to mix a food sample into 100 ml of distilled water and 50 ml of dilute acid. The student is provided with a 1 ml pipette, a 5 ml pipette, a 50 ml graduated cylinder, and a 100 ml flask. The student selects the 5 ml pipette to use in making markings at 50 ml increments on the beaker.
- Did the student carry out the most accurate way for calibrating the beaker? Why or why not?
- Which would be the correct apparatus for calibrating a test tube in two 1 ml increments?
- You are doing a study on crop nutrition. The study is investigating the effects of nitrogen fertilizer concentration on the protein content of plants. Design a simple experiment for carrying out this investigation.
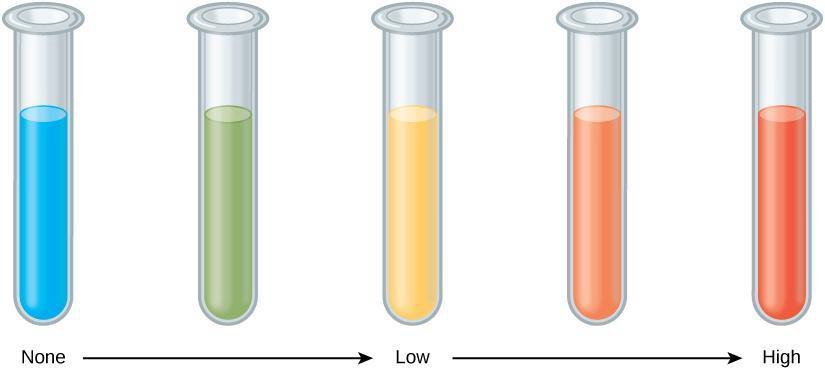
- Use the image of the Benedict’s test Figure 3.6 to help you design an experiment to compare the glucose levels of different foods.