Measuring the Enzymatic Activity of Lactase
Learning Objectives
After completing the lab, the student will be able to:
- Measure enzymatic activity of the enzyme lactase over time and represent it graphically.
Activity 1: Pre-Assessment
- How would the concentration of an enzyme, its substrate(s), and its product(s) change over time as an enzymatic reaction takes place?
- What molecule(s) would you measure to monitor the progress of an enzymatic reaction? How might you observe the relative concentrations of these molecules over the course of the enzymatic reaction?
- Discuss the answers to questions 1 and 2 with the class.
Activity 1: Measuring the Enzymatic Activity of Lactase
How would we measure the activity of a specific enzyme? One easy way to measure the concentration of a chemical is by using a colored indicator. As an enzymatic reaction proceeds, the color of the solution changes and can be monitored visually.
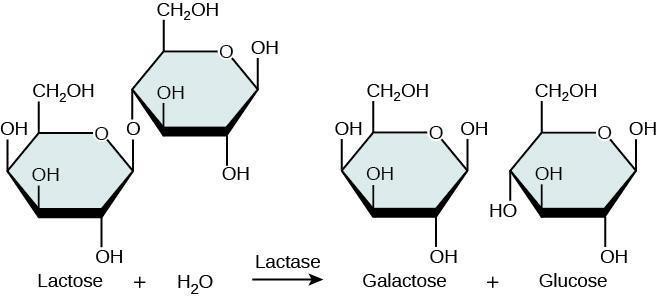
In this lab, you will measure the enzymatic activity of lactase, an enzyme that breaks down lactose, a disaccharide found in milk and other dairy products, into the monosaccharides galactose and glucose (Figure 7.1). While human infants naturally produce lactase, most adults do not, making them lactose intolerant, or unable to produce enough lactase to digest ingested lactose. Interestingly, in the past 10,000 years, several populations of humans have developed lifelong lactase activity. These human populations are often people who raise livestock and drink animal milk. For most individuals who are lactose intolerant, lactase may be purchased in tablet form from pharmacies.
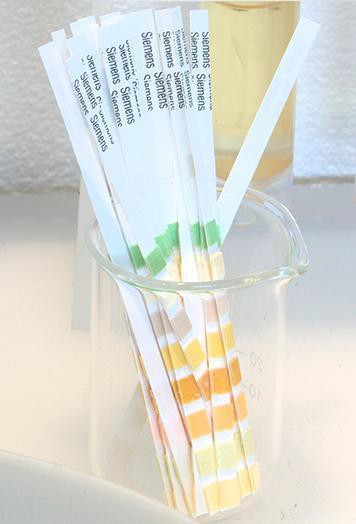
Glucose, one of the products of lactose degradation, can be detected visually using glucose detection strips, which can also be purchased from pharmacies. One type of glucose detection strip contains the dye toluidine blue and the enzyme glucose oxidase (Figure 7.2). Glucose oxidase within the strip converts the glucose to gluconic acid and hydrogen peroxide. Hydrogen peroxide then interacts with the toluidine blue within the strip, bringing about a color change from blue to green to yellow to brown.
Safety Precautions
- Goggles should be worn at all times while in laboratory.
- No open-toe shoes worn in laboratory.
- Measure fluids carefully using graduated cylinders to avoid breakage and spillage.
- Inform your teacher immediately of any broken glassware as it could cause injuries.
- Clean up any spilled fluids to prevent other people from slipping.
For this activity, you will need the following:
- Graduated cylinder
- Beaker
- Water
- Milk
- Lactase (obtained from laboratory supply company)
- Stirring rod
- Test tubes
- Glucose (powdered)
- Balance
- Labeling pencil
- Glucose test strips
- Graph paper
- Timer
For this activity, you will work in pairs.
Structured Inquiry
Step 1: Make 100 mL of a 20 mg/mL glucose solution or obtain this from your instructor. Set up tubes as follows:
- Negative control: 3 mL of water
- Positive control: 3 mL of 20 mg/mL glucose solution
Insert a glucose test strip into each tube, and compare the color you observe to the color chart that comes with the test strips. What is the concentration of glucose in each tube? Are your results what you expected?
Step 2: Hypothesize/Predict: Based upon your knowledge of enzymes and lactase function, predict whether glucose will be detected in milk in the presence of lactase enzyme compared to milk lacking the lactase enzyme. Predict how the glucose concentration of milk will change over time under each of these two conditions. Write your predictions in your lab notebook.
Step 3: With your partner, prepare two tubes each containing 2 mL of milk. Additionally, make your lactase enzyme solution per your teacher’s instructions.
Step 4: Student-led Planning: Your experiment should last for 15 minutes. Create a data table to record glucose concentrations in each of the two tubes of milk at 3-minute intervals. To start the experiment, add 1 mL of water to one of the tubes of milk and 1 mL of the lactase solution to the other. Then, every 3 minutes for 15 minutes, record the concentrations of glucose in each tube using the color chart that came with the test strips and record this in your data table.
Step 5: Critical Analysis: Using graph paper, graph your data of glucose concentration versus time. Which is the independent variable? Which is the dependent variable? Calculate the rates of glucose production for each tube. Are the predictions you made in step 2 supported by your data? Explain how you know in your notebook.
Guided Inquiry
Step 1: Hypothesize/Predict: How do you think increasing the amount of lactase will affect glucose formation? How do you think decreasing the amount of lactase will affect glucose formation? Formulate a hypothesis involving the effect of the lactase amount on glucose formation.
How do you think increasing the amount of milk will affect glucose formation? What would happen if you decreased the amount of milk? Formulate a hypothesis involving the effect of the amount of milk on glucose formation.
Write your hypotheses and predictions in your notebook.
Step 2: Student-led Planning: Select one of the hypotheses above to discuss with your lab partner. Design an experiment to address this hypothesis and submit it to your teacher for approval. Once your teacher approves, create a table to record your data, prepare your test tubes per your design, and record data on glucose production every 3 minutes for 15 minutes. Graph your data and calculate the rate of glucose production for each tube.
Step 3: Critical Analysis: Are the predictions you made in Step 1 supported by your data? Is there any way you could improve your experiment? Discuss your answers with your lab partner and write them in your notebook.
Assessments
- In this experiment, assume that all the lactose provided is broken down to glucose and galactose. Based upon this assumption, if one diluted the amount of milk by half in the tube containing milk and the lactase enzyme, what would happen to the amount of glucose produced? Explain why in terms of molecular interactions of the substrate with the enzyme and enzyme function.
- In this experiment, describe the role of each of the following:
- The water-only tube
- The tube of 20 mg/mL glucose solution
