Measuring Osmosis
Learning Objectives
After completing the lab, the student will be able to:
- Describe how varying concentrations of solutes and solvents affect the rate of osmosis.
- Describe or explain how temperature affects the rate of osmosis.
Activity 2: Pre-Assessment
- What do you think happens to a plant when it is placed in salt water? Why might this occur?
- Discuss the answers to question 1 with the class.
Activity 2: Measuring Osmosis
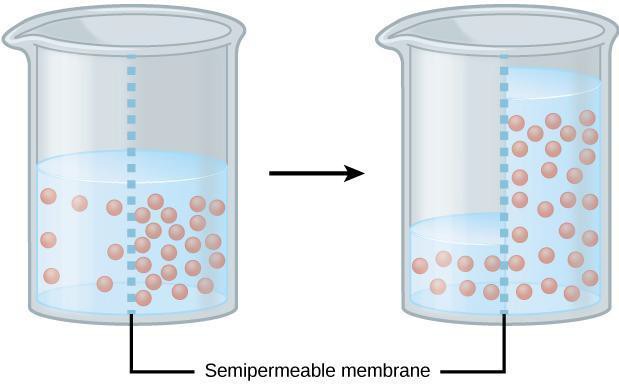
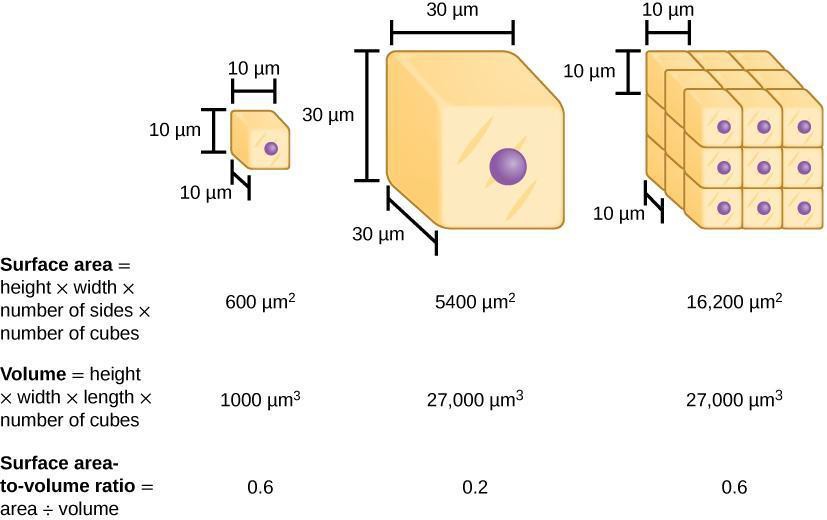
Osmosis is the diffusion of water across a selectively permeable membrane (i.e., cell membrane). Because of osmosis, water will move where water is less concentrated from an area of low solute (high water content) to an area with high solute concentration (low water content) (Figure 6.2). Dialysis tubing is used to model selectively permeable membranes because it will prohibit large molecules from crossing the membrane but will allow small molecules to cross. For example, water and glucose are small molecules that can easily cross the membrane. However, starch (a polymer of glucose), cannot cross due to its large molecular size. Additionally, cell surface area and volume can affect the rate of diffusion across a membrane. The surface area-to-volume ratio describes the relationship between the area outside the cell to the volume inside the cell (Figure 6.3). In this lab, we first will use dialysis tubing to model how the membrane selectively allows certain molecules to cross the membrane. Then, we will compare the diffusion rate of dialysis tubing with a small surface area-to-volume ratio to one that has a large surface area-to-volume ratio.
Safety Precautions
- Safety goggles/glasses should be worn when chemicals or solutions are heated.
- Handle all chemicals safely.
- Inform your teacher immediately of any broken glassware, as it could cause injuries.
- Clean up any spilled water or other fluids to prevent other people from slipping.
- Dispose of all chemicals per local regulations.
- Use caution when performing the Benedict’s reaction, which involves the use of a hot water bath.
For this activity, you will need the following:
- Dialysis tubing, two pieces, about 15 cm each long and narrow (pre-soaked)
- Dialysis tubing, one piece, short and wide (pre-soaked)
- Six Dialysis tubing clamps (optional)
- Three 500 mL beaker
- Water
- 5 percent Glucose solution, 10 mL
- Starch suspension, 10 mL
- Iodine
- Benedict’s reagent
- Graduated cylinder
- Test tube
- Hot water bath
For this activity, you will work in groups of four.
Structured Inquiry
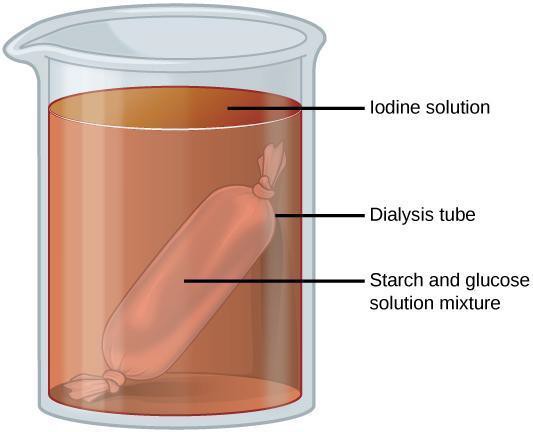
Step 1: Use a graduated cylinder to measure 250 mL of room temperature water in a beaker. Set aside. Obtain 1 piece of long and narrow dialysis tubing. Seal 1 end of the tube by tying a secure knot or attaching a dialysis tubing clamp to the end of the tubing. Put 10 mL of starch suspension and 10 mL of glucose solution in the tube. Then tie or clamp the other end of the tube. Place the sealed tube into the beaker (Figure 6.4). Develop and implement the use of an appropriate controlled experiment to go alongside your experiment. Allow both to sit for 20–30 minutes.
Step 2: Hypothesize/Predict: Consider the molecular sizes of glucose and starch. What do you think will happen with the starch and the glucose inside of the dialysis tube? Predict whether starch and/or glucose will remain inside of the tube or if they will move out.
Step 3: Student-led planning: Briefly remove the dialysis bag from the beaker and set it aside. Pour 2 mL of the water from the beaker into a test tube. Put 10 drops of Benedict’s reagent into the tube (note the initial color of the solution) and place into the hot water bath for 5 minutes. Note whether there is a color change. Place the bag back into the beaker. Put 20 drops of iodine into the water in the beaker. Allow this to sit for about 10 minutes. Determine whether starch is present in the bag and/or the beaker. Describe in your notebook what you observe. Create a data table for your observations that shows whether starch and glucose were inside and/or outside of the dialysis tubing.
Step 4: Critical Analysis: Are the predictions you made in step 2 supported by your data? Why or why not? What methods could you use to improve your results? Discuss with your group and then write your answers in your notebook.
Guided Inquiry
Step 1: Hypothesize/Predict: Predict what would happen to the rate of osmosis if the surface area-to-volume ratio was large (as it would be with small cells compared to larger ones). Record your prediction.
Step 2: Student-led planning: Determine how the rate of osmosis of water using a dialysis bag with starch solution is affected if surface area-to-volume ratio is altered. Use dialysis tubing of 2 different lengths and widths to determine this. Record weights of each bag at different time intervals. Discuss with your group the time points at which you will check the bags for differences in weight over a 20-minute period. Record your data for each. Discuss with your group how best to set up these experiments.
Step 3: Critical Analysis: Create a graph that shows how osmosis rate is affected over time because of alterations in surface area-to-volume ratios. Are the predictions you made in Step 2 supported by your data? Why or why not? What methods could you use to improve your results? Discuss with your group and then write your answers in your notebook.
Assessments
- Would a large protein have difficulty crossing the membrane of a dialysis tube? Why or why not?
- Why do smaller cells have more efficient diffusion compared to larger ones?
