Influence of the Light Reaction on the Concentration of CO2
Learning Objectives
After completing the lab, the student will be able to:
- Measure the dependence of CO2 fixation on the light-dependent reaction.
- Explain the chemical principles of pH indicators and the bicarbonate-CO2 equilibrium.
Activity 1: Pre-Assessment
- Answer the following questions in your notebook: Which gas is released by plants during photosynthesis? Which gas is absorbed during photosynthesis? How does the overall chemical equation for photosynthesis compare to the overall chemical equation for respiration?
- Answer the following questions in your notebook: What chemical reactions take place when CO2 is released in water? What is the connection between an increase in CO2 in the atmosphere and the acidification of oceans? Why are plants essential in mitigating the effects of climate change?
- Discuss the answers to questions 1 and 2 with the class.
Activity 1: Influence of the Light Reaction on the Concentration of CO2
In this experiment, you will predict and test the effect of environmental conditions on the process of photosynthesis. Gaseous carbon dioxide dissolves in water per the reaction
CO2 + H2O↔ H2CO3 ↔ H+ + HCO3–
Carbon dioxide and water combine to generate the unstable carbonic acid molecule that separates into hydrogen and bicarbonate ions effectively lowering the pH of the solution. The reaction is reversible. When CO2 molecules are consumed by photosynthesis, the reaction shifts to the left. Hydrogen ions and bicarbonate ions combine to replace CO2 with the net effect of increasing the pH of the solution.
A pH indicator is a chemical compound that changes color based on pH level. In this experiment, you will use phenol red, which appears yellow at pH below 7, orange at neutral pH, and bright red or pink at basic pH values (see Figure 11.1). How can the presence of phenol red allow measurement of the consumption of CO2 by a plant submerged in water? Discuss the method with your partner and write your answer in your notebook.
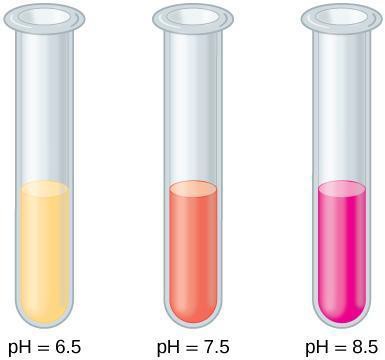
Figure 11.1: The pH indicator phenol red appears yellow at an acidic pH, pinkish orange at a neutral pH, and bright red or pink at a basic pH.
Safety Precautions
- Be careful when blowing into the straw inside the reaction vessels. Do not suck up the solution.
- Do not touch incandescent lamps, because they can be very hot.
- Wear aprons and eye protection.
For this activity, you will need the following:
- Plant material: Elodea or other aquatic plant
- Flasks
- Transfer pipettes
- Solution of phenol red
- New drinking straws
- Test tubes and test tube racks
- Lamp with LED bulb
- Beakers of water
- Hot plate
- Ice
- Aluminum foil
- Acetate colored filter (at a minimum, use blue, red, and green filters)
- Thermometer
- Meter stick
For this activity, you will work in pairs.
Structured Inquiry
Step 1: Hypothesize/Predict: In this experiment, you will measure CO2 uptake in Elodea exposed to light compared to a control Elodea in a control tube where light is blocked. Make a hypothesis with your partner about the color changes you expect to see in the pH indicator when the test tubes are exposed to light. Write down your hypothesis in your notebook. Discuss what you predict will happen to the test tubes kept in the dark. Decide what you will do if you observe no change in the test tubes exposed to light within the time allocated.
Step 2: Student-led planning: Set up the materials described in Step 3 below. If you have access to a camera, you may take pictures of your set-up. Otherwise, draw the set-up in your lab notebook indicating the colors in words or by using colored crayons. What is the control treatment in this setup? Is it a positive control or a negative control? Explain your reasoning in your notebook.
Step 3: Monitor the photosynthetic response by following CO2 uptake, as outlined in the following steps.
- Prepare test tubes for the experiment. First, label all tubes with a piece of tape and a marker to identify the sample. The first tube will contain the sprig of Elodea exposed to light. This is the experimental sample that will be labeled Light. The second tube will contain a sprig of Elodea and will be wrapped in aluminum foil. Label this tube Dark Control because it will serve as a control. The third tube will be labeled Light Control and will contain water and indicator without plant material.
- Prepare a dilute solution of phenol red (mixed with tap water) in sufficient quantity for the test tubes. For example, if you set up test tubes that will contain 25 ml each, prepare 120 ml of solution to make it easier to aliquot equal amounts of solution. If the color is close to red or pink, it means that the tap water is basic. In this case, it may be more practical to use distilled water; since it may be difficult to blow enough CO2 to adjust the pH. The reason for using distilled water is that freshly distilled water has a pH of 7.0. As CO2 from the atmosphere dissolves in the distilled water, the pH drops below 7.0.
- If the starting phenol solution is a light shade of pink, take a clean drinking straw and gently blow bubbles into the solution until it turns bright yellow. What does the yellow color indicate? Write your answer in your notebook.
- Fill test tubes with water as indicated by your teacher (see Step 2). Then add the pH indicator solution.
- Cut leafy sprigs of Elodea with the scissors without crushing the material. To produce comparable results, the sprigs should be similar in length and number of leaves.
- Place the sprigs in the test tubes you prepared for the experiment. Top with water to make sure that the sprigs are fully immersed.
- Record the color of each solution in your lab notebook in a table like Table 11.1. Remember to modify the table to accommodate all your data.
- Wrap a piece of aluminum foil around the tubes if you are measuring photosynthesis in the Dark Control tube. Make sure that there are no light leaks.
- Place a lamp about 0.5 m from your experimental set-up. Place a container of water between the lamp and the test tube to absorb the heat radiating from the bulb if you use an incandescent bulb, as shown in Figure 11.2. LED lamps radiate less heat making it possible to bypass the use of a heat sink.
- Start your watch and record the color of the tap water with phenol indicator solution every 30 minutes. To compare CO2 production in the presence and absence of light, record the end-point color of the test tubes wrapped in aluminum foil after two hours of incubation.
Table 11.1: Change in Phenol Red Color
|
Time (min) |
Tube with Elodea exposed to light |
Tube without Elodea exposed to light |
Tube with Elodea in the dark |
Tube without Elodea in the dark |
|
0 |
|
|
|
|
|
30 |
|
|
|
|
|
60 |
|
|
|
|
|
90 |
|
|
|
|
|
120 |
|
|
|
|
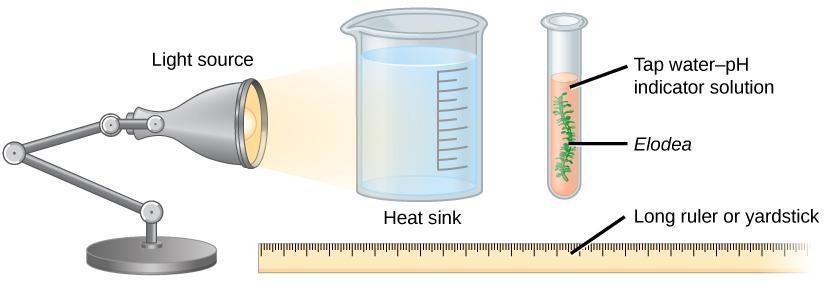
Figure 11.2: Experimental set-up to measure release of CO2 during photosynthesis.
Step 4: Critical Analysis: Record the colors you observe in the test tubes over time in the table you prepared in your lab notebook. What happened to the Dark Control test tubes compared to the Light Control tubes and what does this tell you about the validity of your experiment? Do the experimental results support your hypothesis?
Guided Inquiry
Step 1: Hypothesize/Predict: With your partner, review the process of photosynthesis and decide on an environmental condition you want to test. You may choose to investigate the influence of temperature, light intensity, or light color. Can you dim the room lights to minimize the effect of white light when experimenting with the effect of colored light? Decide with your lab partner how you will test the environmental condition and what you predict will happen to the pH in the solution. Include all necessary controls in your hypothesis. You should also devise a positive and negative control for your experiment. Check with your instructor on the availability of supplies to carry out your experiment.
Step 2: Student-led planning: Set up your experiment following the guidelines described under step 2 of structured inquiry. You may need to shut off the room lights and cover the windows so there is only one light source. When measuring the effect of light intensity, use the equation I=1/D2 where I is light intensity and D is distance. In every case, ensure that you measure only one variable in your set up. The temperature can be kept constant by placing the tube in a water bath. Prepare a table like Table 11.1 in your lab notebook to enter your data.
Step 3: Critical analysis: Record your measurements in your lab notebook. Analyze the results and compare them to your hypothesis. Did the environmental variable affect pH changes as you predicted? What do the changes in pH tell you about the changes in CO2 production? What other factors may have contributed to the results? If you measured the effect of temperature, explain which reactions in photosynthesis would be dependent on temperature? How would you modify the experiment if you were to repeat it? Discuss your results with groups that tested different environmental variables.
Assessments
- In an experiment, the water was first boiled, which drove out all of the existing gases. The water was then added to the test tube containing Elodea, which was then exposed immediately to light. The photosynthetic activity of the Elodea was then monitored but no photosynthetic activity was detected. How can you correct the situation by modifying the composition of the Elodea environment?
- Scientists report that the levels of carbon dioxide are rising in the atmosphere and driving climate change. Another observation is that acidification of oceans is also a consequence of climate change. Can you explain what link may exist between the two phenomena and how it affects the marine ecosystem?
- Farmers report that planting corn plants too closely can stunt growth even when the plants are heavily fertilized and receive plenty of light. Furthermore, the effect seems to be reduced in recent years. What is the growth limiting factor under these conditions? What may be an explanation? How do plants respond to decreased availability of the limiting factor?
