Chapter 11: The Chi-Square Distribution
11.6 Test of a Single Variance
Learning Objectives
By the end of this section, the student should be able to:
- calculate the test of a single variance
A test of a single variance assumes that the underlying distribution is normal. The null and alternative hypotheses are stated in terms of the population variance (or population standard deviation). The test statistic is:
- [latex]n =[/latex] the total number of data
- [latex]s^2 =[/latex] sample variance
- [latex]\sigma^2 =[/latex] population variance
You may think of s as the random variable in this test. The number of degrees of freedom is [latex]df = n - 1[/latex]. A test of a single variance may be right-tailed, left-tailed, or two-tailed. The next example will show you how to set up the null and alternative hypotheses. The null and alternative hypotheses contain statements about the population variance.
Example
Math instructors are not only interested in how their students do on exams, on average, but how the exam scores vary. To many instructors, the variance (or standard deviation) may be more important than the average.
Suppose a math instructor believes that the standard deviation for his final exam is five points. One of his best students thinks otherwise. The student claims that the standard deviation is more than five points. If the student were to conduct a hypothesis test, what would the null and alternative hypotheses be?
Solution
Even though we are given the population standard deviation, we can set up the test using the population variance as follows.
[latex]H_0: \sigma^2 = 52[/latex]
[latex]H_a: \sigma^2 > 52[/latex]
Your Turn!
A SCUBA instructor wants to record the collective depths each of his students dives during their checkout. He is interested in how the depths vary, even though everyone should have been at the same depth. He believes the standard deviation is three feet. His assistant thinks the standard deviation is less than three feet. If the instructor were to conduct a test, what would the null and alternative hypotheses be?
Solution
[latex]H_0: \sigma^2 = 32[/latex]
[latex]H_a: \sigma^2 \lt 32[/latex]
Example
With individual lines at its various windows, a post office finds that the standard deviation for normally distributed waiting times for customers on Friday afternoon is 7.2 minutes. The post office experiments with a single, main waiting line and finds that for a random sample of 25 customers, the waiting times for customers have a standard deviation of 3.5 minutes.
With a significance level of 5%, test the claim that a single line causes lower variation
among waiting times (shorter waiting times) for customers.
Solution
Since the claim is that a single line causes less variation, this is a test of a single variance.
The parameter is the population variance, [latex]\sigma^2[/latex], or the population standard deviation, [latex]\sigma[/latex].
Random Variable: The sample standard deviation, s, is the random variable.
Let [latex]s =[/latex] standard deviation for the waiting times.
- [latex]H_0: \sigma^2 = 7.22[/latex]
- [latex]H_a: \sigma^2 \lt 7.22[/latex]
The word “less” tells you this is a left-tailed test.
Distribution for the test:[latex]{\chi }_{24}^{2}[/latex], where [latex]n =[/latex] the number of customers sampled and [latex]df = n – 1 = 25 – 1 = 24[/latex].
Calculate the test statistic:
[latex]{\chi }^{2}=\frac{\left(n\text{ }-\text{ }1\right){s}^{2}}{{\sigma }^{2}}=\frac{\left(25\text{ }-\text{ }1\right){\left(3.5\right)}^{2}}{{7.2}^{2}}=5.67[/latex] where [latex]n = 25[/latex], [latex]s = 3.5[/latex], and [latex]\sigma = 7.2[/latex].
Graph:
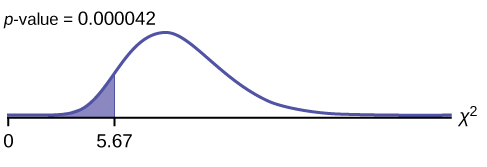
Probability statement: [latex]\text{p-value} = P (\chi^2 \lt 5.67) = 0.000042[/latex]
Compare [latex]\alpha[/latex] and the p-value: [latex]\alpha = 0.05[/latex]; [latex]\text{p-value} = 0.000042[/latex]; [latex]\alpha > \text{p-value}[/latex]
Make a decision: Since [latex]\alpha > \text{p-value}[/latex], reject [latex]H_0[/latex]. This means that you reject [latex]\sigma^2 = 7.22[/latex]. In other words, you do not think the variation in waiting times is 7.2 minutes; you think the variation in waiting times is less.
Conclusion: At a 5% level of significance, from the data, there is sufficient evidence to conclude that a single line causes a lower variation among the waiting times or with a single line, the customer waiting times vary less than 7.2 minutes.
In the calculator:
In 2nd DISTR, use 7: [latex]\chi^2[/latex]cdf. The syntax is (lower, upper, df) for the parameter list.
[latex]\chi^2[/latex]cdf(-1E99,5.67,24). The p-value is 0.000042.
Your Turn!
The FCC conducts broadband speed tests to measure how much data per second passes between a consumer’s computer and the internet. As of August of 2012, the standard deviation of Internet speeds across Internet Service Providers (ISPs) was 12.2 percent. Suppose a sample of 15 ISPs is taken, and the standard deviation is 13.2. An analyst claims that the standard deviation of speeds is more than what was reported. State the null and alternative hypotheses, compute the degrees of freedom, the test statistic, sketch the graph of the p-value, and draw a conclusion. Test at the 1% significance level.
Solution
[latex]H_0: \chi^2 = 12.2^2[/latex]
[latex]H_a: \chi^2 > 12.2^2[/latex]
[latex]df = 14[/latex]
[latex]\chi^2 \text{test statistic} = 16.39[/latex]
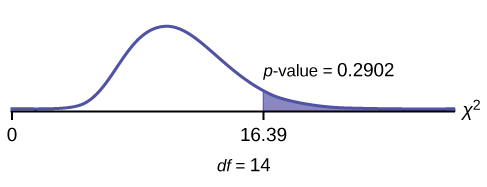
The p-value is 0.2902, so we decline to reject the null hypothesis. There is not enough evidence to suggest that the variance is greater than [latex]12.2^2[/latex].
In 2nd DISTR, use7: [latex]\chi^2[/latex]cdf. The syntax is (lower, upper, df) for the parameter list. [latex]\chi^2[/latex]cdf(16.39,10^99,14). The p-value is 0.2902.
Section 11.6 Review
To test variability, use the chi-square test of a single variance. The test may be left-, right-, or two-tailed, and its hypotheses are always expressed in terms of the variance (or standard deviation).
Formula Review
- Test of a single variance statistic: [latex]{\chi }^{2}=[/latex][latex]\frac{\left(n-1\right)\cdot {s}^{2}}{{\sigma }^{2}}[/latex] where:
- [latex]n:[/latex] sample size
- [latex]s:[/latex] sample standard deviation
- [latex]\sigma:[/latex] population standard deviation
- Degrees of freedom: [latex]df = n – 1[/latex]
- Test of a Single Variance
- Use the test to determine variation.
- The degrees of freedom is the number of samples – 1.
- The test statistic is [latex]\frac{\left(n–1\right)\cdot {s}^{2}}{{\sigma }^{2}}[/latex], where [latex]n = \text{the total number of data}[/latex], [latex]s^2 = \text{sample variance}[/latex], and [latex]\sigma^2 = \text{population variance}[/latex].
- The test may be left-, right-, or two-tailed.
Section 11.6 Practice
Use the following information to answer the next three exercises: An archer’s standard deviation for his hits is six (data is measured in distance from the center of the target). An observer claims the standard deviation is less.
1. What type of test should be used?
Solution
a test of a single variance
2. State the null and alternative hypotheses.
3. Is this a right-tailed, left-tailed, or two-tailed test?
Solution
a left-tailed test
Use the following information to answer the next three exercises: The standard deviation of heights for students in a school is 0.81. A random sample of 50 students is taken, and the standard deviation of heights of the sample is 0.96. A researcher in charge of the study believes the standard deviation of heights for the school is greater than 0.81.
1. What type of test should be used?
2. State the null and alternative hypotheses.
Solution
[latex]H_0: \sigma^2 = 0.81^2; H_a: \sigma^2 > 0.81^2[/latex]
3. [latex]df = \underline{\hspace{2cm}}[/latex]
Use the following information to answer the next four exercises: The average waiting time in a doctor’s office varies. The standard deviation of waiting times in a doctor’s office is 3.4 minutes. A random sample of 30 patients in the doctor’s office has a standard deviation of waiting times of 4.1 minutes. One doctor believes the variance of waiting times is greater than originally thought.
1. What type of test should be used?
Solution
a test of a single variance
2. What is the test statistic?
3. What is the p-value?
Solution
0.0542
4. What can you conclude at the 5% significance level?
Use the following information to answer the next twelve exercises: Suppose an airline claims that its flights are consistently on time with an average delay of at most 15 minutes. It claims that the average delay is so consistent that the variance is no more than 150 minutes. Doubting the consistency part of the claim, a disgruntled traveler calculates the delays for his next 25 flights. The average delay for those 25 flights is 22 minutes with a standard deviation of 15 minutes.
1. Is the traveler disputing the claim about the average or about the variance?
2. A sample standard deviation of 15 minutes is the same as a sample variance of [latex]\underline{\hspace{2cm}}[/latex] minutes.
Solution
225
3. Is this a right-tailed, left-tailed, or two-tailed test?
4. [latex]H_0: \underline{\hspace{2cm}}[/latex]
Solution
[latex]H_0: \sigma^2 \le 150[/latex]
5. [latex]df = \underline{\hspace{2cm}}[/latex]
6. chi-square test statistic [latex]= \underline{\hspace{2cm}}[/latex]
Solution
36
7. p-value [latex]= \underline{\hspace{2cm}}[/latex]
8. Graph the situation. Label and scale the horizontal axis. Mark the mean and test statistic. Shade the p-value.
Solution
Check student’s solution.
9. Let [latex]\alpha = 0.05[/latex]
Decision: [latex]\underline{\hspace{2cm}}[/latex]
Conclusion (write out in a complete sentence.): [latex]\underline{\hspace{2cm}}[/latex]
10. How did you know to test the variance instead of the mean?
Solution
The claim is that the variance is no more than 150 minutes.
11. If an additional test were done on the claim of the average delay, which distribution would you use?
12. If an additional test were done on the claim of the average delay, but 45 flights were surveyed, which distribution would you use?
Solution
a Student’s t– or normal distribution
For each of the following word problems, use the chi-square solution sheet in Chapter 11 Introduction. Round expected frequency to two decimal places.
A plant manager is concerned her equipment may need recalibrating. It seems that the actual weight of the 15 oz. cereal boxes it fills has been fluctuating. The standard deviation should be at most 0.5 oz. In order to determine if the machine needs to be recalibrated, 84 randomly selected boxes of cereal from the next day’s production were weighed. The standard deviation of the 84 boxes was 0.54. Does the machine need to be recalibrated?
Consumers may be interested in whether the cost of a particular calculator varies from store to store. Based on surveying 43 stores, which yielded a sample mean of $84 and a sample standard deviation of $12, test the claim that the standard deviation is greater than $15.
Solution
a. [latex]H_0: \sigma = 15[/latex]
b. [latex]H_a: \sigma > 15[/latex]
c. [latex]df = 42[/latex]
d. chi-square with [latex]df = 42[/latex]
e. test statistic = 26.88
f. p-value = 0.9663
g. Check student’s solution.
h. i. Alpha = 0.05
ii. Decision: Do not reject null hypothesis.
iii. Reason for decision: p-value > alpha
iv. Conclusion: There is insufficient evidence to conclude that the standard deviation is greater than 15.
Isabella, an accomplished Bay to Breakers runner, claims that the standard deviation for her time to run the 7.5 mile race is at most three minutes. To test her claim, Rupinder looks up five of her race times. They are 55 minutes, 61 minutes, 58 minutes, 63 minutes, and 57 minutes.
Airline companies are interested in the consistency of the number of babies on each flight, so that they have adequate safety equipment. They are also interested in the variation of the number of babies. Suppose that an airline executive believes the average number of babies on flights is six with a variance of nine at most. The airline conducts a survey. The results of the 18 flights surveyed give a sample average of 6.4 with a sample standard deviation of 3.9. Conduct a hypothesis test of the airline executive’s belief.
Solution
a. [latex]H_0: \sigma \le 3[/latex]
b. [latex]H_a: \sigma > 3[/latex]
c. [latex]df = 17[/latex]
d. chi-square distribution with [latex]df = 17[/latex]
e. test statistic = 28.73
f. p-value = 0.0371
g. Check student’s solution.
h. i. Alpha: 0.05
ii. Decision: Reject the null hypothesis.
iii. Reason for decision: p-value < alpha
iv. Conclusion: There is sufficient evidence to conclude that the standard deviation is greater than three.
The number of births per woman in China is 1.6 down from 5.91 in 1966. This fertility rate has been attributed to the law passed in 1979 restricting births to one per woman. Suppose that a group of students studied whether or not the standard deviation of births per woman was greater than 0.75. They asked 50 women across China the number of births they had had. The results are shown in the table below. Does the students’ survey indicate that the standard deviation is greater than 0.75?
| # of births | Frequency |
|---|---|
| 0 | 5 |
| 1 | 30 |
| 2 | 10 |
| 3 | 5 |
According to an avid aquarist, the average number of fish in a 20-gallon tank is 10, with a standard deviation of two. His friend, also an aquarist, does not believe that the standard deviation is two. She counts the number of fish in 15 other 20-gallon tanks. Based on the results that follow, do you think that the standard deviation is different from two? Data: 11; 10; 9; 10; 10; 11; 11; 10; 12; 9; 7; 9; 11; 10; 11
Solution
a. [latex]H_0: \sigma = 2[/latex]
b. [latex]H_a: \sigma \neq 2[/latex]
c. [latex]df = 14[/latex]
d. chi-square distribution with [latex]df = 14[/latex]
e. chi-square test statistic = 5.2094
f. p-value = 0.0346
g. Check student’s solution.
h. i. Alpha = 0.05
ii. Decision: Reject the null hypothesis
iii. Reason for decision: p-value < alpha
iv. Conclusion: There is sufficient evidence to conclude that the standard deviation is different than 2.
The manager of “Frenchies” is concerned that patrons are not consistently receiving the same amount of French fries with each order. The chef claims that the standard deviation for a ten-ounce order of fries is at most 1.5 oz., but the manager thinks that it may be higher. He randomly weighs 49 orders of fries, which yields a mean of 11 oz. and a standard deviation of two oz.
You want to buy a specific computer. A sales representative of the manufacturer claims that retail stores sell this computer at an average price of $1,249 with a very narrow standard deviation of $25. You find a website that has a price comparison for the same computer at a series of stores as follows: $1,299; $1,229.99; $1,193.08; $1,279; $1,224.95; $1,229.99; $1,269.95; $1,249. Can you argue that pricing has a larger standard deviation than claimed by the manufacturer? Use the 5% significance level. As a potential buyer, what would be the practical conclusion from your analysis?
Solution
The sample standard deviation is $34.29.
a. [latex]H_0 : \sigma^2 = 25^2[/latex]
b. [latex]H_a : \sigma^2 > 25^2[/latex]
c. [latex]df = n – 1 = 7[/latex]
d. chi-square distribution with [latex]df = 7[/latex]
e. test statistic: [latex]{x}^{2}= {x}_{7}^{2}=\frac{\left(n–1\right){s}^{2}}{{25}^{2}}=\frac{\left(8–1\right){\left(34.29\right)}^{2}}{{25}^{2}}=13.169[/latex];
f. p-value: [latex]P\left({x}_{7}^{2}>13.169\right)=1–P\left({x}_{7}^{2}\le13.169\right)=0.0681[/latex]
g. Check student’s solution.
h. i. Alpha: 0.05
ii. Decision: Do not reject the null hypothesis.
iii. Reason for decision: p-value > alpha
iv. Conclusion: At the 5% level, there is insufficient evidence to conclude that the variance is more than 625.
A company packages apples by weight. One of the weight grades is Class A apples. Class A apples have a mean weight of 150 g, and there is a maximum allowed weight tolerance of 5% above or below the mean for apples in the same consumer package. A batch of apples is selected to be included in a Class A apple package. Given the following apple weights of the batch, does the fruit comply with the Class A grade weight tolerance requirements. Conduct an appropriate hypothesis test.
(a) at the 5% significance level
(b) at the 1% significance level
Weights in selected apple batch (in grams): 158; 167; 149; 169; 164; 139; 154; 150; 157; 171; 152; 161; 141; 166; 172
References
“AppleInsider Price Guides.” Apple Insider, 2013. Available online at http://appleinsider.com/mac_price_guide (accessed May 14, 2013).
Data from the World Bank, June 5, 2012.
