Chapter 11: The Chi-Square Distribution
Introduction to Chapter 11: The Chi-Square Distribution
Have you ever wondered if lottery numbers were evenly distributed or if some numbers occurred with a greater frequency? How about if the types of movies people preferred were different across different age groups? What about if a coffee machine was dispensing approximately the same amount of coffee each time? You could answer these questions by conducting a hypothesis test.
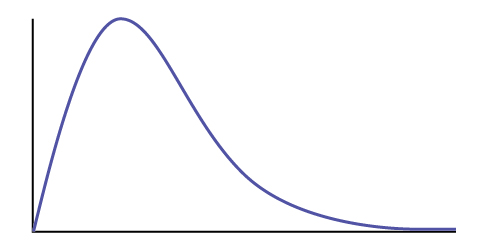
You will now study a new distribution, one that is used to determine the answers to such questions. This distribution is called the chi-square distribution.
In this chapter, you will learn the three major applications of the chi-square distribution:
- the goodness-of-fit test, which determines if data fit a particular distribution, such as in the lottery example
- the test of independence, which determines if events are independent, such as in the movie example
- the test of a single variance, which tests variability, such as in the coffee example
Note
Though the chi-square distribution depends on calculators or computers for most of the calculations, there is a table available. TI-83+ and TI-84 calculator instructions are included in the text.
To do the homework problems for this chapter, use the following solution sheet.
The Chi-Square Distribution Worksheet
- [latex]H_0: \underline{\hspace{2cm}}[/latex]
- [latex]H_a: \underline{\hspace{2cm}}[/latex]
- What are the degrees of freedom?
- State the distribution to use for the test.
- What is the test statistic?
- What is the p-value? In one to two complete sentences, explain what the p-value means for this problem.
- Use the previous information to sketch a picture of this situation. Clearly label and scale the horizontal axis and shade the region(s) corresponding to the p-value.
- Indicate the correct decision (“reject” or “do not reject” the null hypothesis) and write appropriate conclusions, using complete sentences.
- Alpha: [latex]\underline{\hspace{2cm}}[/latex]
- Decision: [latex]\underline{\hspace{2cm}}[/latex]
- Reason for decision: [latex]\underline{\hspace{2cm}}[/latex]
- Conclusion: [latex]\underline{\hspace{2cm}}[/latex]
Media Attributions
- Chapter 11 Introduction Figure © OpenStax Introductory Statistics is licensed under a CC BY (Attribution) license
