Chapter 1: Sampling and Data
Introduction to Chapter 1: Sampling and Data

“Statistics’ ultimate goal is translating data into knowledge” – Alan Agresti & Christine Franklin
You are probably asking yourself the question, “When and where will I use statistics?” If you read any newspaper, watch television, or use the Internet, you will see statistical information. There are statistics about crime, sports, education, politics, and real estate. Typically, when you read a newspaper article or watch a television news program, you are given sample information. With this information, you may make a decision about the correctness of a statement, claim, or “fact.” Statistical methods can help you make the “best educated guess.”
Since you will undoubtedly be given statistical information at some point in your life, you need to know some techniques for analyzing the information thoughtfully. Think about buying a house or managing a budget. Think about your chosen profession. The fields of economics, business, psychology, education, biology, law, computer science, police science, and early childhood development require at least one course in statistics.
Included in this chapter are the basic ideas and words of probability and statistics. You will soon understand that statistics and probability work together. You will also learn how data are gathered and what “good” data can be distinguished from “bad.”
Collaborative Exercises
Section 1.1
Collaborative Exercise 1
In your classroom, try this exercise. Have class members write down the average time (in hours, to the nearest half-hour) they sleep per night. Your instructor will record the data. Then create a simple graph (called a dot plot) of the data. A dot plot consists of a number line and dots (or points) positioned above the number line. For example, consider the following data:
5, 5.5, 6, 6, 6, 6.5, 6.5, 6.5, 6.5, 7, 7, 8, 8, 9
The dot plot for this data would be as follows:
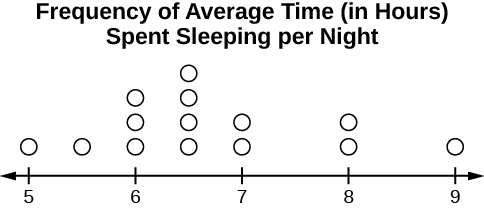
Does your dot plot look the same as or different from the example? Why? If you did the same example in an English class with the same number of students, do you think the results would be the same? Why or why not?
Where do your data appear to cluster? How might you interpret the clustering?
The questions above ask you to analyze and interpret your data. With this example, you have begun your study of statistics.
Collaborative Exercise 2
Do the following exercise collaboratively with up to four people per group.
Find a population, a sample, the parameter, the statistic, a variable, and data for the following study: You want to determine the average (mean) number of glasses of milk college students drink per day. Suppose yesterday, in your English class, you asked five students how many glasses of milk they drank the day before. The answers were 1, 0, 1, 3, and 4 glasses of milk.
Section 1.2
Collaborative Exercise 1
As a class, determine whether or not the following samples are representative. If they are not, discuss the reasons.
- To find the average GPA of all students in a university, use all honor students at the university as the sample.
- To find out the most popular cereal among young people under the age of ten, stand outside a large supermarket for three hours and speak to every twentieth child under age ten who enters the supermarket.
- To find the average annual income of all adults in the United States, sample U.S. congressmen. Create a cluster sample by considering each state as a stratum (group). By using simple random sampling, select states to be part of the cluster. Then survey every U.S. congressman in the cluster.
- To determine the proportion of people taking public transportation to work, survey 20 people in New York City. Conduct the survey by sitting in Central Park on a bench and interviewing every person who sits next to you.
- To determine the average cost of a two-day stay in a hospital in Massachusetts, survey 100 hospitals across the state using simple random sampling.
Collaborative Exercise 2
Divide into groups of two, three, or four. Your instructor will give each group one six-sided die. Try this experiment twice. Roll one fair die (six-sided) 20 times. Record the number of ones, twos, threes, fours, fives, and sixes you get in Table 1 and Table 2 (“frequency” is the number of times a particular face of the die occurs):
| Face on Die | Frequency |
|---|---|
| 1 | |
| 2 | |
| 3 | |
| 4 | |
| 5 | |
| 6 |
Table 1
| Face on Die | Frequency |
|---|---|
| 1 | |
| 2 | |
| 3 | |
| 4 | |
| 5 | |
| 6 |
Table 2
Did the two experiments have the same results? Probably not. If you did the experiment a third time, do you expect the results to be identical to the first or second experiment? Why or why not?
Which experiment had the correct results? They both did. The job of the statistician is to see through the variability and draw appropriate conclusions.
Section 1.3
Collaborative Exercise
In your class, have someone conduct a survey of the number of siblings (brothers and sisters) each student has. Create a frequency table. Add to it a relative frequency column and a cumulative relative frequency column. Answer the following questions:
- What percentage of the students in your class have no siblings?
- What percentage of the students have from one to three siblings?
- What percentage of the students have fewer than three siblings?
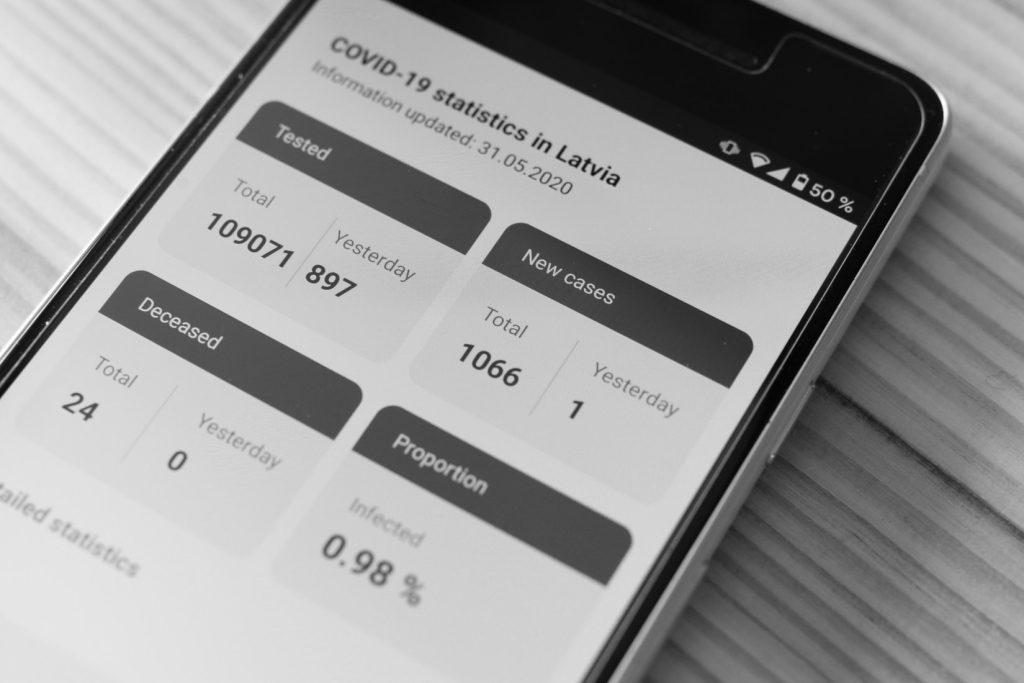
Media Attributions
- Private: Chapter 1 Introduction Figure 1a © Markus Winkler (2020). “Corona death and new cases stats.” adapted by Significant Statistics is licensed under a Public Domain license
- Chapter 1 Introduction Figure 1b © OpenStax Introductory Statistics is licensed under a CC BY (Attribution) license
also called mean; a number that describes the central tendency of the data
