Chapter 11: The Chi-Square Distribution
Chapter 11 Review
11.1 Review
The chi-square distribution is a useful tool for assessment in a series of problem categories. These problem categories include primarily (i) whether a data set fits a particular distribution, (ii) whether the distributions of two populations are the same, (iii) whether two events might be independent, and (iv) whether there is a different variability than expected within a population.
An important parameter in a chi-square distribution is the degrees of freedom df in a given problem. The random variable in the chi-square distribution is the sum of squares of df standard normal variables, which must be independent. The key characteristics of the chi-square distribution also depend directly on the degrees of freedom.
The chi-square distribution curve is skewed to the right, and its shape depends on the degrees of freedom df. For df > 90, the curve approximates the normal distribution. Test statistics based on the chi-square distribution are always greater than or equal to zero. Such application tests are almost always right-tailed tests.
Formula Review
χ2 = (Z1)2 + (Z2)2 + … (Zdf)2
chi-square distribution random variable
μχ2 = df chi-square distribution population mean
[latex]{\sigma }_{{\chi }^{2}}\text{=}\sqrt{2\left(df\right)}[/latex] Chi-Square distribution population standard deviation
If the number of degrees of freedom for a chi-square distribution is 25, what is the population mean and standard deviation?
Solution
mean = 25 and standard deviation = 7.0711
If df > 90, the distribution is _____________. If df = 15, the distribution is ________________.
When does the chi-square curve approximate a normal distribution?
Solution
when the number of degrees of freedom is greater than 90
Where is μ located on a chi-square curve?
Is it more likely the df is 90, 20, or two in the graph?
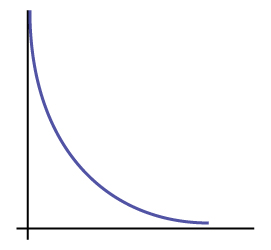
Solution
df = 2
11.2 Review
To assess whether a data set fits a specific distribution, you can apply the goodness-of-fit hypothesis test that uses the chi-square distribution. The null hypothesis for this test states that the data come from the assumed distribution. The test compares observed values against the values you would expect to have if your data followed the assumed distribution. The test is almost always right-tailed. Each observation or cell category must have an expected value of at least five.
Formula Review
[latex]\sum _{k}\frac{{\left(O-E\right)}^{2}}{E}[/latex]
goodness-of-fit test statistic where:
O: observed values
E: expected values
k: number of different data cells or categories
df = k − 1 degrees of freedom
Determine the appropriate test to be used in the next three exercises.
An archeologist is calculating the distribution of the frequency of the number of artifacts she finds in a dig site. Based on previous digs, the archeologist creates an expected distribution broken down by grid sections in the dig site. Once the site has been fully excavated, she compares the actual number of artifacts found in each grid section to see if her expectation was accurate.
An economist is deriving a model to predict outcomes on the stock market. He creates a list of expected points on the stock market index for the next two weeks. At the close of each day’s trading, he records the actual points on the index. He wants to see how well his model matched what actually happened.
Solution
a goodness-of-fit test
A personal trainer is putting together a weight-lifting program for her clients. For a 90-day program, she expects each client to lift a specific maximum weight each week. As she goes along, she records the actual maximum weights her clients lifted. She wants to know how well her expectations met with what was observed.
Use the following information to answer the next five exercises: A teacher predicts that the distribution of grades on the final exam will be and they are recorded in [link].
| Grade | Proportion |
|---|---|
| A | 0.25 |
| B | 0.30 |
| C | 0.35 |
| D | 0.10 |
The actual distribution for a class of 20 is in [link].
| Grade | Frequency |
|---|---|
| A | 7 |
| B | 7 |
| C | 5 |
| D | 1 |
[latex]df=[/latex] ______
Solution
3
State the null and alternative hypotheses.
χ2 test statistic = ______
Solution
2.04
p-value = ______
At the 5% significance level, what can you conclude?
Solution
We decline to reject the null hypothesis. There is not enough evidence to suggest that the observed test scores are significantly different from the expected test scores.
Use the following information to answer the next nine exercises: The following data are real. The cumulative number of AIDS cases reported for Santa Clara County is broken down by ethnicity as in [link].
| Ethnicity | Number of Cases |
|---|---|
| White | 2,229 |
| Hispanic | 1,157 |
| Black/African-American | 457 |
| Asian, Pacific Islander | 232 |
| Total = 4,075 |
The percentage of each ethnic group in Santa Clara County is as in [link].
| Ethnicity | Percentage of total county population | Number expected (round to two decimal places) |
|---|---|---|
| White | 42.9% | 1748.18 |
| Hispanic | 26.7% | |
| Black/African-American | 2.6% | |
| Asian, Pacific Islander | 27.8% | |
| Total = 100% |
If the ethnicities of AIDS victims followed the ethnicities of the total county population, fill in the expected number of cases per ethnic group.
Perform a goodness-of-fit test to determine whether the occurrence of AIDS cases follows the ethnicities of the general population of Santa Clara County.
H0: _______
Solution
H0: the distribution of AIDS cases follows the ethnicities of the general population of Santa Clara County.
Ha: _______
Is this a right-tailed, left-tailed, or two-tailed test?
Solution
right-tailed
degrees of freedom = _______
χ2 test statistic = _______
Solution
88,621
p-value = _______
Graph the situation. Label and scale the horizontal axis. Mark the mean and test statistic. Shade in the region corresponding to the p-value.

Let α = 0.05
Decision: ________________
Reason for the Decision: ________________
Conclusion (write out in complete sentences): ________________
Solution
Graph: Check student’s solution.
Decision: Reject the null hypothesis.
Reason for the Decision: p-value < alpha
Conclusion (write out in complete sentences): The make-up of AIDS cases does not fit the ethnicities of the general population of Santa Clara County.
Does it appear that the pattern of AIDS cases in Santa Clara County corresponds to the distribution of ethnic groups in this county? Why or why not?
11.3 Review
To assess whether two factors are independent or not, you can apply the test of independence that uses the chi-square distribution. The null hypothesis for this test states that the two factors are independent. The test compares observed values to expected values. The test is right-tailed. Each observation or cell category must have an expected value of at least 5.
Formula Review
- The number of degrees of freedom is equal to (number of columns – 1)(number of rows – 1).
- The test statistic is
[latex]\underset{\left(i\cdot j\right)}{\Sigma }\frac{{\left(O–E\right)}^{2}}{E}[/latex] where
O = observed values,
E = expected values,
i = the number of rows in the table, and
j = the number of columns in the table. - If the null hypothesis is true, the expected number
[latex]E=\frac{\text{(row total)(column total)}}{\text{total surveyed}}[/latex].
Determine the appropriate test to be used in the next three exercises.
A pharmaceutical company is interested in the relationship between age and presentation of symptoms for a common viral infection. A random sample is taken of 500 people with the infection across different age groups.
Solution
a test of independence
The owner of a baseball team is interested in the relationship between player salaries and team winning percentage. He takes a random sample of 100 players from different organizations.
A marathon runner is interested in the relationship between the brand of shoes runners wear and their run times. She takes a random sample of 50 runners and records their run times as well as the brand of shoes they were wearing.
Solution
a test of independence
Use the following information to answer the next seven exercises: Transit Railroads is interested in the relationship between travel distance and the ticket class purchased. A random sample of 200 passengers is taken. [link] shows the results. The railroad wants to know if a passenger’s choice in ticket class is independent of the distance they must travel.
| Traveling Distance | Third class | Second class | First class | Total |
|---|---|---|---|---|
| 1–100 miles | 21 | 14 | 6 | 41 |
| 101–200 miles | 18 | 16 | 8 | 42 |
| 201–300 miles | 16 | 17 | 15 | 48 |
| 301–400 miles | 12 | 14 | 21 | 47 |
| 401–500 miles | 6 | 6 | 10 | 22 |
| Total | 73 | 67 | 60 | 200 |
State the hypotheses.
H0: _______
Ha: _______
df = _______
Solution
8
How many passengers are expected to travel between 201 and 300 miles and purchase second-class tickets?
How many passengers are expected to travel between 401 and 500 miles and purchase first-class tickets?
Solution
6.6
What is the test statistic?
What is the p-value?
Solution
0.0435
What can you conclude at the 5% level of significance?
Use the following information to answer the next eight exercises: An article in the New England Journal of Medicine, discussed a study on smokers in California and Hawaii. In one part of the report, the self-reported ethnicity and smoking levels per day were given. Of the people smoking at most ten cigarettes per day, there were 9,886 African Americans, 2,745 Native Hawaiians, 12,831 Latinos, 8,378 Japanese Americans and 7,650 whites. Of the people smoking 11 to 20 cigarettes per day, there were 6,514 African Americans, 3,062 Native Hawaiians, 4,932 Latinos, 10,680 Japanese Americans, and 9,877 whites. Of the people smoking 21 to 30 cigarettes per day, there were 1,671 African Americans, 1,419 Native Hawaiians, 1,406 Latinos, 4,715 Japanese Americans, and 6,062 whites. Of the people smoking at least 31 cigarettes per day, there were 759 African Americans, 788 Native Hawaiians, 800 Latinos, 2,305 Japanese Americans, and 3,970 whites.
Complete the table.
| Smoking Level per Day | African American | Native Hawaiian | Latino | Japanese Americans | White | TOTALS |
|---|---|---|---|---|---|---|
| 1-10 | ||||||
| 11-20 | ||||||
| 21-30 | ||||||
| 31+ | ||||||
| TOTALS |
Solution
| Smoking Level per Day | African American | Native Hawaiian | Latino | Japanese Americans | White | Totals |
|---|---|---|---|---|---|---|
| 1-10 | 9,886 | 2,745 | 12,831 | 8,378 | 7,650 | 41,490 |
| 11-20 | 6,514 | 3,062 | 4,932 | 10,680 | 9,877 | 35,065 |
| 21-30 | 1,671 | 1,419 | 1,406 | 4,715 | 6,062 | 15,273 |
| 31+ | 759 | 788 | 800 | 2,305 | 3,970 | 8,622 |
| Totals | 18,830 | 8,014 | 19,969 | 26,078 | 27,559 | 10,0450 |
State the hypotheses.
H0: _______
Ha: _______
Enter expected values in [link]. Round to two decimal places.
Calculate the following values:
Solution
| Smoking Level per Day | African American | Native Hawaiian | Latino | Japanese Americans | White |
|---|---|---|---|---|---|
| 1-10 | 7777.57 | 3310.11 | 8248.02 | 10771.29 | 11383.01 |
| 11-20 | 6573.16 | 2797.52 | 6970.76 | 9103.29 | 9620.27 |
| 21-30 | 2863.02 | 1218.49 | 3036.20 | 3965.05 | 4190.23 |
| 31+ | 1616.25 | 687.87 | 1714.01 | 2238.37 | 2365.49 |
df = _______
[latex]{\chi }^{\text{2}}[/latex] test statistic = ______
Solution
10,301.8
p-value = ______
Is this a right-tailed, left-tailed, or two-tailed test? Explain why.
Solution
right
Graph the situation. Label and scale the horizontal axis. Mark the mean and test statistic. Shade in the region corresponding to the p-value.

State the decision and conclusion (in a complete sentence) for the following preconceived levels of α.
α = 0.05
- Decision: ___________________
- Reason for the decision: ___________________
- Conclusion (write out in a complete sentence): ___________________
Solution
- Reject the null hypothesis.
- p-value < alpha
- There is sufficient evidence to conclude that smoking level is dependent on ethnic group.
α = 0.01
- Decision: ___________________
- Reason for the decision: ___________________
- Conclusion (write out in a complete sentence): ___________________
11.4 Review
To assess whether two data sets are derived from the same distribution—which need not be known, you can apply the test for homogeneity that uses the chi-square distribution. The null hypothesis for this test states that the populations of the two data sets come from the same distribution. The test compares the observed values against the expected values if the two populations followed the same distribution. The test is right-tailed. Each observation or cell category must have an expected value of at least five.
Formula Review
[latex]\sum _{i\cdot j}\frac{{\left(O-E\right)}^{2}}{E}[/latex] Homogeneity test statistic where: O = observed values
E = expected values
i = number of rows in data contingency table
j = number of columns in data contingency table
df = (i −1)(j −1) Degrees of freedom
A math teacher wants to see if two of her classes have the same distribution of test scores. What test should she use?
Solution
test for homogeneity
What are the null and alternative hypotheses for [link]?
A market researcher wants to see if two different stores have the same distribution of sales throughout the year. What type of test should he use?
Solution
test for homogeneity
A meteorologist wants to know if East and West Australia have the same distribution of storms. What type of test should she use?
What condition must be met to use the test for homogeneity?
Solution
All values in the table must be greater than or equal to five.
Use the following information to answer the next five exercises: Do private practice doctors and hospital doctors have the same distribution of working hours? Suppose that a sample of 100 private practice doctors and 150 hospital doctors are selected at random and asked about the number of hours a week they work. The results are shown in [link].
| 20–30 | 30–40 | 40–50 | 50–60 | |
|---|---|---|---|---|
| Private Practice | 16 | 40 | 38 | 6 |
| Hospital | 8 | 44 | 59 | 39 |
State the null and alternative hypotheses.
df = _______
Solution
3
What is the test statistic?
What is the p-value?
Solution
0.00005
What can you conclude at the 5% significance level?
11.5 Review
The goodness-of-fit test is typically used to determine if data fits a particular distribution. The test of independence makes use of a contingency table to determine the independence of two factors. The test for homogeneity determines whether two populations come from the same distribution, even if this distribution is unknown.
Which test do you use to decide whether an observed distribution is the same as an expected distribution?
Solution
a goodness-of-fit test
What is the null hypothesis for the type of test from [link]?
Which test would you use to decide whether two factors have a relationship?
Solution
a test for independence
Which test would you use to decide if two populations have the same distribution?
How are tests of independence similar to tests for homogeneity?
Solution
Answers will vary. Sample answer: Tests of independence and tests for homogeneity both calculate the test statistic the same way [latex]\sum _{\left(ij\right)}\frac{{\left(O-E\right)}^{2}}{E}[/latex]. In addition, all values must be greater than or equal to five.
How are tests of independence different from tests for homogeneity?
11.6 Review
To test variability, use the chi-square test of a single variance. The test may be left-, right-, or two-tailed, and its hypotheses are always expressed in terms of the variance (or standard deviation).
Formula Review
[latex]{\chi }^{2}=[/latex][latex]\frac{\left(n-1\right)\cdot {s}^{2}}{{\sigma }^{2}}[/latex] Test of a single variance statistic where:
n: sample size
s: sample standard deviation
σ: population standard deviation
df = n – 1 Degrees of freedom
- Use the test to determine variation.
- The degrees of freedom is the number of samples – 1.
- The test statistic is [latex]\frac{\left(n–1\right)\cdot {s}^{2}}{{\sigma }^{2}}[/latex], where n = the total number of data, s2 = sample variance, and σ2 = population variance.
- The test may be left-, right-, or two-tailed.
Use the following information to answer the next three exercises: An archer’s standard deviation for his hits is six (data is measured in distance from the center of the target). An observer claims the standard deviation is less.
What type of test should be used?
Solution
a test of a single variance
State the null and alternative hypotheses.
Is this a right-tailed, left-tailed, or two-tailed test?
Solution
a left-tailed test
Use the following information to answer the next three exercises: The standard deviation of heights for students in a school is 0.81. A random sample of 50 students is taken, and the standard deviation of heights of the sample is 0.96. A researcher in charge of the study believes the standard deviation of heights for the school is greater than 0.81.
What type of test should be used?
State the null and alternative hypotheses.
Solution
H0: σ2 = 0.812;
Ha: σ2 > 0.812
df = ________
Use the following information to answer the next four exercises: The average waiting time in a doctor’s office varies. The standard deviation of waiting times in a doctor’s office is 3.4 minutes. A random sample of 30 patients in the doctor’s office has a standard deviation of waiting times of 4.1 minutes. One doctor believes the variance of waiting times is greater than originally thought.
What type of test should be used?
Solution
a test of a single variance
What is the test statistic?
What is the p-value?
Solution
0.0542
What can you conclude at the 5% significance level?
