Chapter 7: Confidence Intervals
Chapter 7 Practice
7.1 Practice
The standard deviation of the weights of elephants is known to be approximately 15 pounds. We wish to construct a 95% confidence interval for the mean weight of newborn elephant calves. Fifty newborn elephants are weighed. The sample mean is 244 pounds. The sample standard deviation is 11 pounds.
Identify the following:
- [latex]\overline{x}[/latex] = _____
- σ = _____
- n = _____
Solution
- 244
- 15
- 50
In words, define the random variables X and [latex]\overline{X}[/latex].
Which distribution should you use for this problem?
Solution
[latex]N\left(244,\frac{15}{\sqrt{50}}\right)[/latex]
Construct a 95% confidence interval for the population mean weight of newborn elephants. State the confidence interval, sketch the graph, and calculate the error bound.
What will happen to the confidence interval obtained, if 500 newborn elephants are weighed instead of 50? Why?
Solution
As the sample size increases, there will be less variability in the mean, so the interval size decreases.
Use the following information to answer the next seven exercises: The U.S. Census Bureau conducts a study to determine the time needed to complete the short form. The Bureau surveys 200 people. The sample mean is 8.2 minutes. There is a known standard deviation of 2.2 minutes. The population distribution is assumed to be normal.
Identify the following:
- [latex]\overline{x}[/latex] = _____
- σ = _____
- n = _____
In words, define the random variables X and [latex]\overline{X}[/latex].
Solution
X is the time in minutes it takes to complete the U.S. Census short form. [latex]\overline{X}[/latex] is the mean time it took a sample of 200 people to complete the U.S. Census short form.
Which distribution should you use for this problem?
Construct a 90% confidence interval for the population mean time to complete the forms. State the confidence interval, sketch the graph, and calculate the error bound.
Solution
CI: (7.9441, 8.4559)
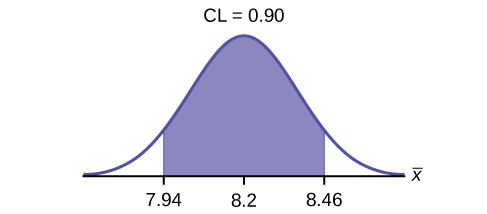
EBM = 0.26
If the Census wants to increase its level of confidence and keep the error bound the same by taking another survey, what changes should it make?
If the Census did another survey, kept the error bound the same, and surveyed only 50 people instead of 200, what would happen to the level of confidence? Why?
Solution
The level of confidence would decrease because decreasing n makes the confidence interval wider, so at the same error bound, the confidence level decreases.
Suppose the Census needed to be 98% confident of the population mean length of time. Would the Census have to survey more people? Why or why not?
Use the following information to answer the next ten exercises: A sample of 20 heads of lettuce was selected. Assume that the population distribution of head weight is normal. The weight of each head of lettuce was then recorded. The mean weight was 2.2 pounds with a standard deviation of 0.1 pounds. The population standard deviation is known to be 0.2 pounds.
Identify the following:
- [latex]\overline{x}[/latex] = ______
- σ = ______
- n = ______
Solution
- [latex]\overline{x}[/latex] = 2.2
- σ = 0.2
- n = 20
In words, define the random variable X.
In words, define the random variable [latex]\overline{X}[/latex].
Solution
[latex]\overline{X}[/latex] is the mean weight of a sample of 20 heads of lettuce.
Which distribution should you use for this problem?
Construct a 90% confidence interval for the population mean weight of the heads of lettuce. State the confidence interval, sketch the graph, and calculate the error bound.
Solution
EBM = 0.07
CI: (2.1264, 2.2736)

Construct a 95% confidence interval for the population mean weight of the heads of lettuce. State the confidence interval, sketch the graph, and calculate the error bound.
Solution
The interval is greater because the level of confidence increased. If the only change made in the analysis is a change in confidence level, then all we are doing is changing how much area is being calculated for the normal distribution. Therefore, a larger confidence level results in larger areas and larger intervals.
In complete sentences, give an interpretation of what the interval in [link] means.
What would happen if 40 heads of lettuce were sampled instead of 20, and the error bound remained the same?
Solution
The confidence level would increase.
What would happen if 40 heads of lettuce were sampled instead of 20, and the confidence level remained the same?
Use the following information to answer the next 14 exercises: The mean age for all Foothill College students for a recent Fall term was 33.2. The population standard deviation has been pretty consistent at 15. Suppose that twenty-five Winter students were randomly selected. The mean age for the sample was 30.4. We are interested in the true mean age for Winter Foothill College students. Let X = the age of a Winter Foothill College student.
[latex]\overline{x}[/latex] = _____
Solution
30.4
n = _____
________ = 15
Solution
σ
In words, define the random variable [latex]\overline{X}[/latex].
What is [latex]\overline{x}[/latex] estimating?
Solution
μ
Is [latex]{\sigma }_{x}[/latex] known?
As a result of your answer to [link], state the exact distribution to use when calculating the confidence interval.
Solution
normal
Construct a 95% Confidence Interval for the true mean age of Winter Foothill College students by working out then answering the next seven exercises.
How much area is in both tails (combined)? α =________
How much area is in each tail? [latex]\frac{\alpha }{2}[/latex] =________
Solution
0.025
Identify the following specifications:
The 95% confidence interval is:__________________.
Solution
(24.52,36.28)
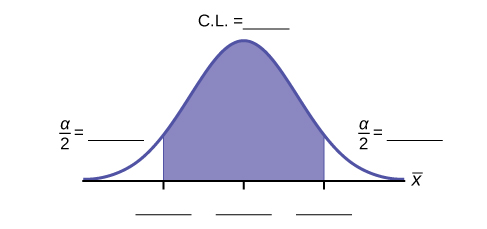
Fill in the blanks on the graph with the areas, upper and lower limits of the confidence interval, and the sample mean.

In one complete sentence, explain what the interval means.
Solution
We are 95% confident that the true mean age for Winger Foothill College students is between 24.52 and 36.28.
Using the same mean, standard deviation, and level of confidence, suppose that n were 69 instead of 25. Would the error bound become larger or smaller? How do you know?
Using the same mean, standard deviation, and sample size, how would the error bound change if the confidence level were reduced to 90%? Why?
Solution
The error bound for the mean would decrease because as the CL decreases, you need less area under the normal curve (which translates into a smaller interval) to capture the true population mean.
7.2 Practice
A hospital is trying to cut down on emergency room wait times. It is interested in the amount of time patients must wait before being called back to be examined. An investigation committee randomly surveyed 70 patients. The sample mean was 1.5 hours with a sample standard deviation of 0.5 hours.
Identify the following:
- [latex]\overline{x}[/latex] =_______
- [latex]{s}_{x}[/latex] =_______
- n =_______
- n – 1 =_______
Define the random variables X and [latex]\overline{X}[/latex] in words.
Solution
X is the number of hours a patient waits in the emergency room before being called back to be examined. [latex]\overline{X}[/latex] is the mean wait time of 70 patients in the emergency room.
Which distribution should you use for this problem?
Construct a 95% confidence interval for the population mean time spent waiting. State the confidence interval, sketch the graph, and calculate the error bound.
Solution
CI: (1.3808, 1.6192)
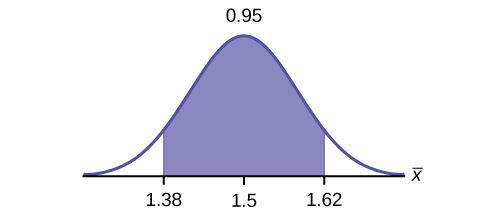
EBM = 0.12
Explain in complete sentences what the confidence interval means.
Use the following information to answer the next six exercises: One hundred eight Americans were surveyed to determine the number of hours they spend watching television each month. It was revealed that they watched an average of 151 hours each month with a standard deviation of 32 hours. Assume that the underlying population distribution is normal.
Identify the following:
- [latex]\overline{x}[/latex] =_______
- [latex]{s}_{x}[/latex] =_______
- n =_______
- n – 1 =_______
Solution
- [latex]\overline{x}[/latex] = 151
- [latex]{s}_{x}[/latex] = 32
- n = 108
- n – 1 = 107
Define the random variable X in words.
Define the random variable [latex]\overline{X}[/latex] in words.
Solution
[latex]\overline{X}[/latex] is the mean number of hours spent watching television per month from a sample of 108 Americans.
Which distribution should you use for this problem?
Construct a 99% confidence interval for the population mean hours spent watching television per month. (a) State the confidence interval, (b) sketch the graph, and (c) calculate the error bound.
Solution
CI: (142.92, 159.08)
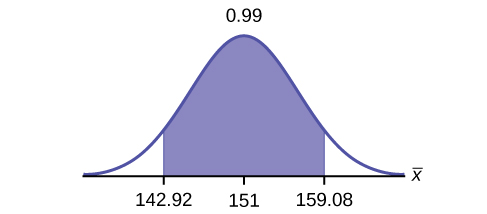
EBM = 8.08
Why would the error bound change if the confidence level were lowered to 95%?
Use the following information to answer the next 13 exercises: The data in [link] are the result of a random survey of 39 national flags (with replacement between picks) from various countries. We are interested in finding a confidence interval for the true mean number of colors on a national flag. Let X = the number of colors on a national flag.
| X | Freq. |
|---|---|
| 1 | 1 |
| 2 | 7 |
| 3 | 18 |
| 4 | 7 |
| 5 | 6 |
Calculate the following:
- [latex]\overline{x}[/latex] =______
- [latex]{s}_{x}[/latex] =______
- n =______
Solution
- 3.26
- 1.02
- 39
Define the random variable [latex]\overline{X}[/latex] in words.
What is [latex]\overline{x}[/latex] estimating?
Solution
μ
Is [latex]{\sigma }_{x}[/latex] known?
As a result of your answer to [link], state the exact distribution to use when calculating the confidence interval.
Solution
t38
Construct a 95% confidence interval for the true mean number of colors on national flags.
How much area is in both tails (combined)?
How much area is in each tail?
Solution
0.025
Calculate the following:
The 95% confidence interval is_____.
Solution
(2.93, 3.59)
Fill in the blanks on the graph with the areas, the upper and lower limits of the Confidence Interval and the sample mean.
In one complete sentence, explain what the interval means.
Solution
We are 95% confident that the true mean number of colors for national flags is between 2.93 colors and 3.59 colors.
Using the same [latex]\overline{x}[/latex], [latex]{s}_{x}[/latex], and level of confidence, suppose that n were 69 instead of 39. Would the error bound become larger or smaller? How do you know?
Solution
The error bound would become EBM = 0.245. This error bound decreases because as sample sizes increase, variability decreases and we need less interval length to capture the true mean.
Using the same [latex]\overline{x}[/latex], [latex]{s}_{x}[/latex], and n = 39, how would the error bound change if the confidence level were reduced to 90%? Why?
7.3 Practice
Marketing companies are interested in knowing the population percent of women who make the majority of household purchasing decisions.
When designing a study to determine this population proportion, what is the minimum number you would need to survey to be 90% confident that the population proportion is estimated to within 0.05?
If it were later determined that it was important to be more than 90% confident and a new survey were commissioned, how would it affect the minimum number you need to survey? Why?
Solution
It would decrease, because the z-score would decrease, which would reduce the numerator and lower the number.
Use the following information to answer the next five exercises: Suppose the marketing company did do a survey. They randomly surveyed 200 households and found that in 120 of them, the woman made the majority of the purchasing decisions. We are interested in the population proportion of households where women make the majority of the purchasing decisions.
Identify the following:
- x = ______
- n = ______
- p′ = ______
Define the random variables X and P′ in words.
Solution
X is the number of “successes” where the woman makes the majority of the purchasing decisions for the household. P′ is the percentage of households sampled where the woman makes the majority of the purchasing decisions for the household.
Which distribution should you use for this problem?
Construct a 95% confidence interval for the population proportion of households where the women make the majority of the purchasing decisions. State the confidence interval, sketch the graph, and calculate the error bound.
Solution
CI: (0.5321, 0.6679)
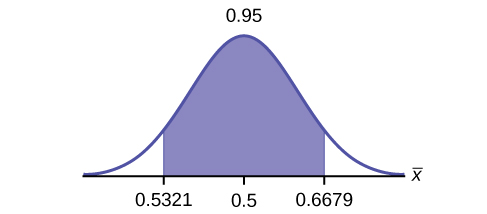
EBM: 0.0679
List two difficulties the company might have in obtaining random results, if this survey were done by email.
Use the following information to answer the next five exercises: Of 1,050 randomly selected adults, 360 identified themselves as manual laborers, 280 identified themselves as non-manual wage earners, 250 identified themselves as mid-level managers, and 160 identified themselves as executives. In the survey, 82% of manual laborers preferred trucks, 62% of non-manual wage earners preferred trucks, 54% of mid-level managers preferred trucks, and 26% of executives preferred trucks.
We are interested in finding the 95% confidence interval for the percent of executives who prefer trucks. Define random variables X and P′ in words.
Solution
X is the number of “successes” where an executive prefers a truck. P′ is the percentage of executives sampled who prefer a truck.
Which distribution should you use for this problem?
Construct a 95% confidence interval. State the confidence interval, sketch the graph, and calculate the error bound.
Solution
CI: (0.19432, 0.33068)
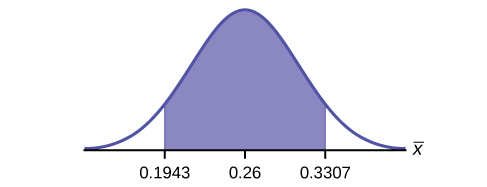
EBM: 0.0707
Suppose we want to lower the sampling error. What is one way to accomplish that?
The sampling error given in the survey is ±2%. Explain what the ±2% means.
Solution
The sampling error means that the true mean can be 2% above or below the sample mean.
Use the following information to answer the next five exercises: A poll of 1,200 voters asked what the most significant issue was in the upcoming election. Sixty-five percent answered the economy. We are interested in the population proportion of voters who feel the economy is the most important.
Define the random variable X in words.
Define the random variable P′ in words.
Solution
P′ is the proportion of voters sampled who said the economy is the most important issue in the upcoming election.
Which distribution should you use for this problem?
Construct a 90% confidence interval, and state the confidence interval and the error bound.
Solution
CI: (0.62735, 0.67265)
EBM: 0.02265
What would happen to the confidence interval if the level of confidence were 95%?
Use the following information to answer the next 16 exercises: The Ice Chalet offers dozens of different beginning ice-skating classes. All of the class names are put into a bucket. The 5 P.M., Monday night, ages 8 to 12, beginning ice-skating class was picked. In that class were 64 girls and 16 boys. Suppose that we are interested in the true proportion of girls, ages 8 to 12, in all beginning ice-skating classes at the Ice Chalet. Assume that the children in the selected class are a random sample of the population.
What is being counted?
Solution
The number of girls, ages 8 to 12, in the 5 P.M. Monday night beginning ice-skating class.
In words, define the random variable X.
Calculate the following:
Solution
- x = 64
- n = 80
- p′ = 0.8
State the estimated distribution of X. X~________
Define a new random variable P′. What is p′ estimating?
Solution
p
In words, define the random variable P′.
State the estimated distribution of P′. Construct a 92% Confidence Interval for the true proportion of girls in the ages 8 to 12 beginning ice-skating classes at the Ice Chalet.
Solution
[latex]{P}^{\prime }~N\left(0.8,\sqrt{\frac{\left(0.8\right)\left(0.2\right)}{80}}\right)[/latex]. (0.72171, 0.87829).
How much area is in both tails (combined)?
How much area is in each tail?
Solution
0.04
Calculate the following:
The 92% confidence interval is _______.
Solution
(0.72; 0.88)
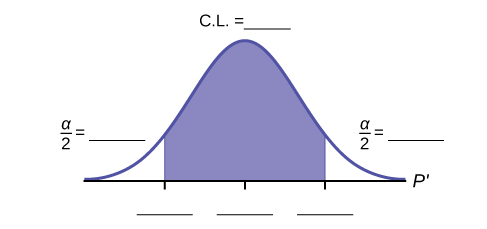
Fill in the blanks on the graph with the areas, upper and lower limits of the confidence interval, and the sample proportion.
In one complete sentence, explain what the interval means.
Solution
With 92% confidence, we estimate the proportion of girls, ages 8 to 12, in a beginning ice-skating class at the Ice Chalet to be between 72% and 88%.
Using the same p′ and level of confidence, suppose that n was increased to 100. Would the error bound become larger or smaller? How do you know?
Using the same p′ and n = 80, how would the error bound change if the confidence level were increased to 98%? Why?
Solution
The error bound would increase. Assuming all other variables are kept constant, as the confidence level increases, the area under the curve corresponding to the confidence level becomes larger, which creates a wider interval and thus a larger error.
If you decrease the allowable error bound, why would the minimum sample size increase (keeping the same level of confidence)?
