Chapter 1: Sampling and Data
Chapter 1 Homework
HOMEWORK from 1.2
For each of the following eight exercises, identify: a. the population, b. the sample,
c. the parameter, d. the statistic, e. the variable, and f. the data. Give examples where appropriate.
A fitness center is interested in the mean amount of time a client exercises in the center each
week.
Solution
The population is all of the clients of the fitness center.
A sample of the clients that use the fitness center for a given week.
The average amount of time that all clients exercise in one week.
The average amount of time that a sample of clients exercises in one week.
The amount of time that a client exercises in one week.
Examples are: 2 hours, 5 hours, and 7.5 hours
–>
Ski resorts are interested in the mean age that children take their first ski and snowboard lessons. They need this information to plan their ski classes optimally.
Solution
- all children who take ski or snowboard lessons
- a group of these children
- the population mean age of children who take their first snowboard lesson
- the sample mean age of children who take their first snowboard lesson
- X = the age of one child who takes his or her first ski or snowboard lesson
- values for X, such as 3, 7, and so on
A cardiologist is interested in the mean recovery period of her patients who have had heart attacks.
Solution
the cardiologist’s patients
a group of the cardiologist’s patients
the mean recovery period of all of the cardiologist’s patients
the mean recovery period of the group of the cardiologist’s patients
X = the mean recovery period of one patient
values for X, such as 10 days, 14 days, 20 days, and so on
–>
Insurance companies are interested in the mean health costs each year of their clients, so that they can determine the costs of health insurance.
Solution
- the clients of the insurance companies
- a group of the clients
- the mean health costs of the clients
- the mean health costs of the sample
- X = the health costs of one client
- values for X, such as 34, 9, 82, and so on
A politician is interested in the proportion of voters in his district who think he is doing a good job.
Solution
all voters in the politician’s district
a random selection of voters in the politician’s district
the proportion of voters in this district who think this politician is doing a good job
the proportion of voters in this district who think this politician is doing a good job in the sample
X = the number of voters in the district who think this politician is doing a good job
Yes, he is doing a good job. No, he is not doing a good job.
–>
A marriage counselor is interested in the proportion of clients she counsels who stay married.
Solution
- all the clients of this counselor
- a group of clients of this marriage counselor
- the proportion of all her clients who stay married
- the proportion of the sample of the counselor’s clients who stay married
- X = the number of couples who stay married
- yes, no
Political pollsters may be interested in the proportion of people who will vote for a particular
cause.
Solution
all voters (in a certain geographic area)
a random selection of all the voters
the proportion of voters who are interested in this particular cause
the proportion of voters who are interested in this particular cause in the sample
X = the number of voters who are interested in this particular cause
yes, no –>
A marketing company is interested in the proportion of people who will buy a particular product.
Solution
- all people (maybe in a certain geographic area, such as the United States)
- a group of the people
- the proportion of all people who will buy the product
- the proportion of the sample who will buy the product
- X = the number of people who will buy it
- buy, not buy
Use the following information to answer the next three exercises: A Lake Tahoe Community College instructor is interested in the mean number of days Lake Tahoe Community College math students are absent from class during a quarter.
What is the population she is interested in?
- all Lake Tahoe Community College students
- all Lake Tahoe Community College English students
- all Lake Tahoe Community College students in her classes
- all Lake Tahoe Community College math students
Solution
d –>
Consider the following:
[latex]X[/latex] = number of days a Lake Tahoe Community College math student is absent
In this case, X is an example of a:
- variable.
- population.
- statistic.
- data.
Solution
a
The instructor’s sample produces a mean number of days absent of 3.5 days. This value is an example of a:
- parameter.
- data.
- statistic.
- variable.
Solution
c –>
More Homework from 1.2
HOMEWORK
For the following exercises, identify the type of data that would be used to describe a response (quantitative discrete, quantitative continuous, or qualitative), and give an example of the data.
number of tickets sold to a concert
Solution
quantitative discrete, 150
percentage of body fat
Solution
quantitative continuous, 19.2%
–>
favorite baseball team
Solution
qualitative, Oakland A’s
time in line to buy groceries
Solution
quantitative continuous, 7.2 minutes
–>
number of students enrolled at Evergreen Valley College
Solution
quantitative discrete, 11,234 students
most-watched television show
Solution
qualitative, Dancing with the Stars
–>
brand of toothpaste
Solution
qualitative, Crest
distance to the closest movie theater
Solution
quantitative continuous, 8.32 miles
–>
age of executives in Fortune 500 companies
Solution
quantitative continuous, 47.3 years
number of competing computer spreadsheet software packages
Solution
quantitative discrete, three
–>
Use the following information to answer the next two exercises: A study was done to determine the age, number of times per week, and the duration (amount of time) of resident use of a local park in San Jose. The first house in the neighborhood around the park was selected randomly and then every 8th house in the neighborhood around the park was interviewed.
“Number of times per week” is what type of data?
- qualitative
- quantitative discrete
- quantitative continuous
Solution
b
“Duration (amount of time)” is what type of data?
- qualitative
- quantitative discrete
- quantitative continuous
Solution
c –>
Airline companies are interested in the consistency of the number of babies on each flight, so that they have adequate safety equipment. Suppose an airline conducts a survey. Over Thanksgiving weekend, it surveys six flights from Boston to Salt Lake City to determine the number of babies on the flights. It determines the amount of safety equipment needed by the result of that study.
- Using complete sentences, list three things wrong with the way the survey was conducted.
- Using complete sentences, list three ways that you would improve the survey if it were to be repeated.
Solution
- The survey was conducted using six similar flights.
The survey would not be a true representation of the entire population of air travelers.
Conducting the survey on a holiday weekend will not produce representative results.
- Conduct the survey during different times of the year.
Conduct the survey using flights to and from various locations.
Conduct the survey on different days of the week.
Suppose you want to determine the mean number of students per statistics class in your state.
Describe a possible sampling method in three to five complete sentences. Make the description detailed.
Solution
Answers will vary. Sample Answer: Randomly choose 25 colleges in the state. Use all statistics classes from each of the chosen colleges in the sample. This can be done by listing all the colleges together with a two-digit number starting with 00 then 01, etc. The list of colleges can be found on Wikipedia. http://en.wikipedia.org/wiki/List_of_colleges_and_universities_in_California Use a random number generator to pick 25 colleges. –>
Suppose you want to determine the mean number of cans of soda drunk each month by students in their twenties at your school. Describe a possible sampling method in three to five complete sentences. Make the description detailed.
Solution
Answers will vary. Sample Answer: You could use a systematic sampling method. Stop the tenth person as they leave one of the buildings on campus at 9:50 in the morning. Then stop the tenth person as they leave a different building on campus at 1:50 in the afternoon.
List some practical difficulties involved in getting accurate results from a telephone survey.
Solution
Answers will vary. Sample Answer: Not all people have a listed phone number. Many people hang up or do not respond to phone surveys. –>
List some practical difficulties involved in getting accurate results from a mailed survey.
Solution
Answers will vary. Sample Answer: Many people will not respond to mail surveys. If they do respond to the surveys, you can’t be sure who is responding. In addition, mailing lists can be incomplete.
With your classmates, brainstorm some ways you could overcome these problems if you needed to conduct a phone or mail survey.
Solution
Ask everyone to include their age then take a random sample from the data. Include in the report how the survey was conducted and why the results may not be accurate.
–>
The instructor takes her sample by gathering data on five randomly selected students from each Lake Tahoe Community College math class. The type of sampling she used is
- cluster sampling
- stratified sampling
- simple random sampling
- convenience sampling
Solution
b
A study was done to determine the age, number of times per week, and the duration (amount of time) of residents using a local park in San Jose. The first house in the neighborhood around the park was selected randomly and then every eighth house in the neighborhood around the park was interviewed. The sampling method was:
- simple random
- systematic
- stratified
- cluster
Solution
b
–>
Name the sampling method used in each of the following situations:
Solution
convenienceclusterstratified systematicsimple random
A “random survey” was conducted of 3,274 people of the “microprocessor generation” (people born since 1971, the year the microprocessor was invented). It was reported that 48% of those individuals surveyed stated that if they had 💲2,000 to spend, they would use it for computer equipment. Also, 66% of those surveyed considered themselves relatively savvy computer users.
- Do you consider the sample size large enough for a study of this type? Why or why not?
- Based on your “gut feeling,” do you believe the percentages accurately reflect the U.S. population for those individuals born since 1971? If not, do you think the percentages of the population are actually higher or lower than the sample statistics? Why?
Additional information: The survey, reported by Intel Corporation, was filled out by individuals who visited the Los Angeles Convention Center to see the Smithsonian Institute’s road show called “America’s Smithsonian.”
- With this additional information, do you feel that all demographic and ethnic groups were equally represented at the event? Why or why not?
- With the additional information, comment on how accurately you think the sample statistics reflect the population parameters.
Solution
Yes, in polling, samples that are from 1,200 to 1,500 observations are considered large enough and good enough if the survey is random and is well done.
We do not have enough information to decide if this is a random sample from the U.S. population.
No, this is a convenience sample taken from individuals who visited an exhibition in the Angeles Convention Center. This sample is not representative of the U.S. population.
It is possible that the two sample statistics, 48% and 66% are larger than the true parameters in the population at large. In any event, no conclusion about the population proportions can be inferred from this convenience sample.
–>
The Gallup-Healthways Well-Being Index is a survey that follows trends of U.S. residents on a regular basis. There are six areas of health and wellness covered in the survey: Life Evaluation, Emotional Health, Physical Health, Healthy Behavior, Work Environment, and Basic Access. Some of the questions used to measure the Index are listed below.
Identify the type of data obtained from each question used in this survey: qualitative, quantitative discrete, or quantitative continuous.
- Do you have any health problems that prevent you from doing any of the things people your age can normally do?
- During the past 30 days, for about how many days did poor health keep you from doing your usual activities?
- In the last seven days, on how many days did you exercise for 30 minutes or more?
- Do you have health insurance coverage?
Solution
- qualitative
- quantitative discrete
- quantitative discrete
- qualitative
In advance of the 1936 Presidential Election, a magazine titled Literary Digest released the results of an opinion poll predicting that the republican candidate Alf Landon would win by a large margin. The magazine sent postcards to approximately 10,000,000 prospective voters. These prospective voters were selected from the subscription list of the magazine, from automobile registration lists, from phone lists, and from club membership lists. Approximately 2,300,000 people returned the postcards.
- Think about the state of the United States in 1936. Explain why a sample chosen from magazine subscription lists, automobile registration lists, phone books, and club membership lists was not representative of the population of the United States at that time.
- What effect does the low response rate have on the reliability of the sample?
- Are these problems examples of sampling error or nonsampling error?
- During the same year, George Gallup conducted his own poll of 30,000 prospective voters. His researchers used a method they called “quota sampling” to obtain survey answers from specific subsets of the population. Quota sampling is an example of which sampling method described in this module?
Solution
The country was in the middle of the Great Depression, and many people could not afford these “luxury” items and therefore were not able to be included in the survey.
Samples that are too small can lead to sampling bias.
sampling error
stratified
–>
Crime-related and demographic statistics for 47 US states in 1960 were collected from government agencies, including the FBI’s Uniform Crime Report. One analysis of this data found a strong connection between education and crime indicating that higher levels of education in a community correspond to higher crime rates.
Which of the potential problems with samples discussed in [link] could explain this connection?
Solution
Causality: The fact that two variables are related does not guarantee that one variable is influencing the other. We cannot assume that crime rate impacts education level or that education level impacts crime rate.
Confounding: There are many factors that define a community other than education level and crime rate. Communities with high crime rates and high education levels may have other lurking variables that distinguish them from communities with lower crime rates and lower education levels. Because we cannot isolate these variables of interest, we cannot draw valid conclusions about the connection between education and crime. Possible lurking variables include police expenditures, unemployment levels, region, average age, and size.
YouPolls is a website that allows anyone to create and respond to polls. One question posted April 15 asks:
“Do you feel happy paying your taxes when members of the Obama administration are allowed to ignore their tax liabilities?”1
As of April 25, 11 people responded to this question. Each participant answered “NO!”
Which of the potential problems with samples discussed in this module could explain this connection?
Solution
Self-Selected Samples: Only people who are interested in the topic are choosing to respond.
Sample Size Issues: A sample with only 11 participants will not accurately represent the opinions of a nation.
Undue Influence: The question is wording in a specific way to generate a specific response.
Self-Funded or Self-Interest Studies: This question was generated to support one person’s claim and it was designed to get the answer that the person desires.
–>
A scholarly article about response rates begins with the following quote:
“Declining contact and cooperation rates in random digit dial (RDD) national telephone surveys raise serious concerns about the validity of estimates drawn from such research.”2
The Pew Research Center for People and the Press admits:
“The percentage of people we interview – out of all we try to interview – has been declining over the past decade or more.”3
- What are some reasons for the decline in response rate over the past decade?
- Explain why researchers are concerned with the impact of the declining response rate on public opinion polls.
Solution
- Possible reasons: increased use of caller id, decreased use of landlines, increased use of private numbers, voice mail, privacy managers, hectic nature of personal schedules, decreased willingness to be interviewed
- When a large number of people refuse to participate, then the sample may not have the same characteristics of the population. Perhaps the majority of people willing to participate are doing so because they feel strongly about the subject of the survey.
Bringing It Together
Seven hundred and seventy-one distance learning students at Long Beach City College responded to surveys in the 2010-11 academic year. Highlights of the summary report are listed in [link].
| Have computer at home | 96% |
| Unable to come to campus for classes | 65% |
| Age 41 or over | 24% |
| Would like LBCC to offer more DL courses | 95% |
| Took DL classes due to a disability | 17% |
| Live at least 16 miles from campus | 13% |
| Took DL courses to fulfill transfer requirements | 71% |
- What percentage of the students surveyed do not have a computer at home?
- About how many students in the survey live at least 16 miles from campus?
- If the same survey were done at Great Basin College in Elko, Nevada, do you think the percentages would be the same? Why?
Solution
4%
13%
Not necessarily. Long Beach City is the seventh largest college in California, and it has an enrollment of approximately 27,000 students. On the other hand, Great Basin College has its campuses in rural northeastern Nevada, and its enrollment of about 3,500 students.
–>
Several online textbook retailers advertise that they have lower prices than on-campus bookstores. However, an important factor is whether the Internet retailers actually have the textbooks that students need in stock. Students need to be able to get textbooks promptly at the beginning of the college term. If the book is not available, then a student would not be able to get the textbook at all, or might get a delayed delivery if the book is back ordered.
A college newspaper reporter is investigating textbook availability at online retailers. He decides to investigate one textbook for each of the following seven subjects: calculus, biology, chemistry, physics, statistics, geology, and general engineering. He consults textbook industry sales data and selects the most popular nationally used textbook in each of these subjects. He visits websites for a random sample of major online textbook sellers and looks up each of these seven textbooks to see if they are available in stock for quick delivery through these retailers. Based on his investigation, he writes an article in which he draws conclusions about the overall availability of all college textbooks through online textbook retailers.
Write an analysis of his study that addresses the following issues: Is his sample representative of the population of all college textbooks? Explain why or why not. Describe some possible sources of bias in this study, and how it might affect the results of the study. Give some suggestions about what could be done to improve the study.
Solution
Answers will vary. Sample answer: The sample is not representative of the population of all college textbooks. Two reasons why it is not representative are that he only sampled seven subjects and he only investigated one textbook in each subject. There are several possible sources of bias in the study. The seven subjects that he investigated are all in mathematics and the sciences; there are many subjects in the humanities, social sciences, and other subject areas (for example: literature, art, history, psychology, sociology, business) that he did not investigate at all. It may be that different subject areas exhibit different patterns of textbook availability, but his sample would not detect such results.
He also looked only at the most popular textbook in each of the subjects he investigated. The availability of the most popular textbooks may differ from the availability of other textbooks in one of two ways:
- the most popular textbooks may be more readily available online, because more new
copies are printed, and more students nationwide are selling back their used copies, OR - the most popular textbooks may be harder to find available online, because more student demand exhausts the supply more quickly.
In reality, many college students do not use the most popular textbooks in their subject, and this study gives no useful information about the situation for those less popular textbooks.
He could improve this study by:
- expanding the selection of subjects he investigates so that it is more representative of all subjects studied by college students, and
- expanding the selection of textbooks he investigates within each subject to include a
mixed representation of both the most popular and less popular textbooks.
HOMEWORK from 1.3
Fifty part-time students were asked how many courses they were taking this term. The (incomplete) results are shown below:
| # of Courses | Frequency | Relative Frequency | Cumulative Relative Frequency |
|---|---|---|---|
| 1 | 30 | 0.6 | |
| 2 | 15 | ||
| 3 |
- Fill in the blanks in [link].
- What percent of students take exactly two courses?
- What percent of students take one or two courses?
Solution
30%
90%
–>
Sixty adults with gum disease were asked the number of times per week they used to floss before their diagnosis. The (incomplete) results are shown in [link].
| # Flossing per Week | Frequency | Relative Frequency | Cumulative Relative Freq. |
|---|---|---|---|
| 0 | 27 | 0.4500 | |
| 1 | 18 | ||
| 3 | 0.9333 | ||
| 6 | 3 | 0.0500 | |
| 7 | 1 | 0.0167 |
- Fill in the blanks in [link].
- What percent of adults flossed six times per week?
- What percentage flossed at most three times per week?
Solution
-
# Flossing per Week Frequency Relative Frequency Cumulative Relative Frequency 0 27 0.4500 0.4500 1 18 0.3000 0.7500 3 11 0.1833 0.9333 6 3 0.0500 0.9833 7 1 0.0167 1 - 5.00%
- 93.33%
Nineteen immigrants to the U.S were asked how many years, to the nearest year, they have lived in the U.S. The data are as follows: 257221020150702051215124510.
[link] was produced.
| Data | Frequency | Relative Frequency | Cumulative Relative Frequency |
|---|---|---|---|
| 0 | 2 | [latex]\frac{2}{19}[/latex] | 0.1053 |
| 2 | 3 | [latex]\frac{3}{19}[/latex] | 0.2632 |
| 4 | 1 | [latex]\frac{1}{19}[/latex] | 0.3158 |
| 5 | 3 | [latex]\frac{3}{19}[/latex] | 0.4737 |
| 7 | 2 | [latex]\frac{2}{19}[/latex] | 0.5789 |
| 10 | 2 | [latex]\frac{2}{19}[/latex] | 0.6842 |
| 12 | 2 | [latex]\frac{2}{19}[/latex] | 0.7895 |
| 15 | 1 | [latex]\frac{1}{19}[/latex] | 0.8421 |
| 20 | 1 | [latex]\frac{1}{19}[/latex] | 1.0000 |
- Fix the errors in [link]. Also, explain how someone might have arrived at the incorrect
number(s). - Explain what is wrong with this statement: “47 percent of the people surveyed have lived in the U.S. for 5 years.”
- Fix the statement in b to make it correct.
- What fraction of the people surveyed have lived in the U.S. five or seven years?
- What fraction of the people surveyed have lived in the U.S. at most 12 years?
- What fraction of the people surveyed have lived in the U.S. fewer than 12 years?
- What fraction of the people surveyed have lived in the U.S. from five to 20 years, inclusive?
Solution
The Frequencies for 15 and 20 should both be two and the Relative Frequencies should both be
2
19
The mistake could be due to copying the data down wrong. The Cumulative Relative Frequency for five years should be 0.4737. The mistake is due to calculating the Relative Frequency instead of the Cumulative Relative Frequency. The Cumulative Relative Frequency for 15 years should be 0.8947
The 47% is the Cumulative Relative Frequency, not the Relative Frequency.
47% of the people surveyed have lived in the U.S. for five years or less.
5
19
15
19
13
19
13
19
–>
How much time does it take to travel to work? [link] shows the mean commute time by state for workers at least 16 years old who are not working at home. Find the mean travel time, and round off the answer properly.
| 24.0 | 24.3 | 25.9 | 18.9 | 27.5 | 17.9 | 21.8 | 20.9 | 16.7 | 27.3 |
| 18.2 | 24.7 | 20.0 | 22.6 | 23.9 | 18.0 | 31.4 | 22.3 | 24.0 | 25.5 |
| 24.7 | 24.6 | 28.1 | 24.9 | 22.6 | 23.6 | 23.4 | 25.7 | 24.8 | 25.5 |
| 21.2 | 25.7 | 23.1 | 23.0 | 23.9 | 26.0 | 16.3 | 23.1 | 21.4 | 21.5 |
| 27.0 | 27.0 | 18.6 | 31.7 | 23.3 | 30.1 | 22.9 | 23.3 | 21.7 | 18.6 |
Solution
The sum of the travel times is 1,173.1. Divide the sum by 50 to calculate the mean value: 23.462. Because each state’s travel time was measured to the nearest tenth, round this calculation to the nearest hundredth: 23.46.
Forbes magazine published data on the best small firms in 2012. These were firms which had been publicly traded for at least a year, have a stock price of at least 💲5 per share, and have reported annual revenue between 💲5 million and 💲1 billion. [link] shows the ages of the chief executive officers for the first 60 ranked firms.
| Age | Frequency | Relative Frequency | Cumulative Relative Frequency |
|---|---|---|---|
| 40–44 | 3 | ||
| 45–49 | 11 | ||
| 50–54 | 13 | ||
| 55–59 | 16 | ||
| 60–64 | 10 | ||
| 65–69 | 6 | ||
| 70–74 | 1 |
- What is the frequency for CEO ages between 54 and 65?
- What percentage of CEOs are 65 years or older?
- What is the relative frequency of ages under 50?
- What is the cumulative relative frequency for CEOs younger than 55?
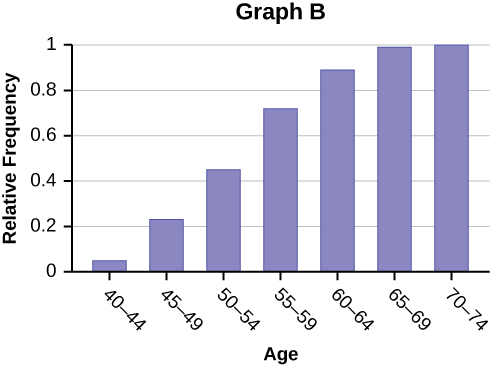
- Which graph shows the relative frequency and which shows the cumulative relative frequency?
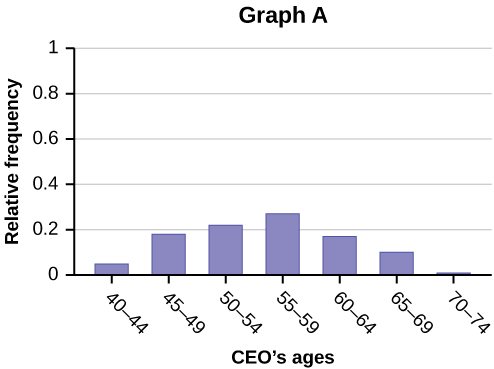
Solution
26 (This is the count of CEOs in the 55 to 59 and 60 to 64 categories.)
12% (number of CEOs age 65 or older ÷ total number of CEOs)
14/60; 0.23; 23%
0.45
Graph A represents the cumulative relative frequency, and Graph B shows the relative frequency.
–>
Use the following information to answer the next two exercises:[link] contains data on hurricanes that have made direct hits on the U.S. Between 1851 and 2004. A hurricane is given a strength category rating based on the minimum wind speed generated by the storm.
| Category | Number of Direct Hits | Relative Frequency | Cumulative Frequency |
|---|---|---|---|
| Total = 273 | |||
| 1 | 109 | 0.3993 | 0.3993 |
| 2 | 72 | 0.2637 | 0.6630 |
| 3 | 71 | 0.2601 | |
| 4 | 18 | 0.9890 | |
| 5 | 3 | 0.0110 | 1.0000 |
What is the relative frequency of direct hits that were category 4 hurricanes?
- 0.0768
- 0.0659
- 0.2601
- Not enough information to calculate
Solution
b
What is the relative frequency of direct hits that were AT MOST a category 3 storm?
- 0.3480
- 0.9231
- 0.2601
- 0.3370
Solution
b
–>
HOMEWORK from 1.4
How does sleep deprivation affect your ability to drive? A recent study measured the effects on 19 professional drivers. Each driver participated in two experimental sessions: one after normal sleep and one after 27 hours of total sleep deprivation. The treatments were assigned in random order. In each session, performance was measured on a variety of tasks including a driving simulation.
Use key terms from this module to describe the design of this experiment.
Solution
Explanatory variable: amount of sleep
Response variable: performance measured in assigned tasks
Treatments: normal sleep and 27 hours of total sleep deprivation
Experimental Units: 19 professional drivers
Lurking variables: none – all drivers participated in both treatments
Random assignment: treatments were assigned in random order; this eliminated the effect of any “learning” that may take place during the first experimental session
Control/Placebo: completing the experimental session under normal sleep conditions
Blinding: researchers evaluating subjects’ performance must not know which treatment is being applied at the time
An advertisement for Acme Investments displays the two graphs in [link] to show
the value of Acme’s product in comparison with the Other Guy’s product. Describe the potentially
misleading visual effect of these comparison graphs. How can this be corrected?
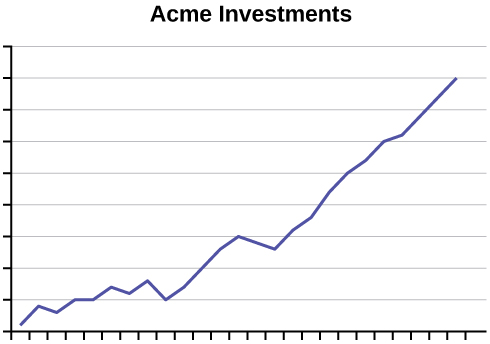
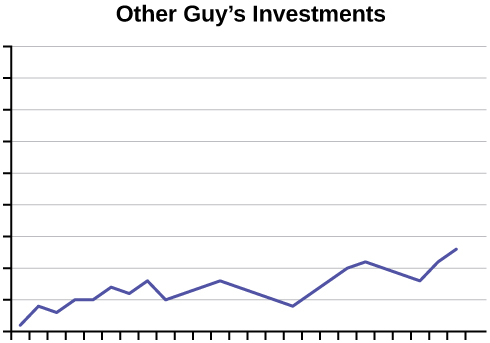
Solution
The graphs do not show scales of values. We do not know the period of time each graph represents; they may show data from different years. We also do not know if the vertical scales on each graph are equivalent. The scales may have been adjusted to exaggerate or minimize trends. There is no reliable information to be gleaned from these graphs, and setting them up as examples of performance is misleading.
–>
The graph in [link] shows the number of complaints for six different airlines as reported to the US Department of Transportation in February 2013. Alaska, Pinnacle, and Airtran Airlines have far fewer complaints reported than American, Delta, and United. Can we conclude that American, Delta, and United are the worst airline carriers since they have the most complaints?
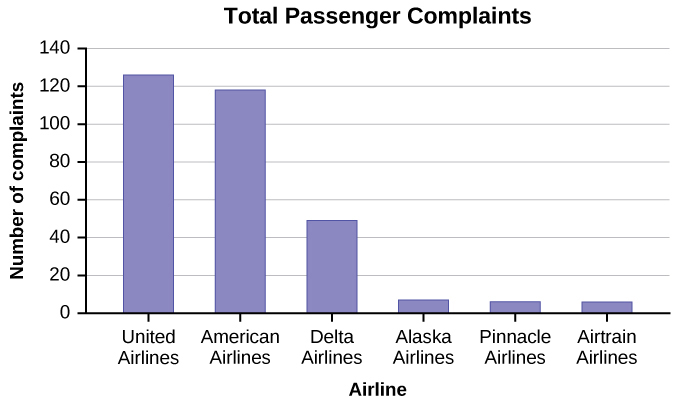
Solution
You cannot assume that the numbers of complaints reflect the quality of the airlines. The airlines shown with the greatest number of complaints are the ones with the most passengers. You must consider the appropriateness of methods for presenting data; in this case displaying totals is misleading.
