Chapter 6: The Normal Distribution and The Central Limit Theorem
Chapter 6 Practice
Section 6.1 Practice
A bottle of water contains 12.05 fluid ounces with a standard deviation of 0.01 ounces. Define the random variable X in words. X = ____________.
Solution
ounces of water in a bottle
A normal distribution has a mean of 61 and a standard deviation of 15. What is the median?
Solution
61
If X ~ N(1, 2).
σ = _______
Solution
2
A company manufactures rubber balls. The mean diameter of a ball is 12 cm with a standard deviation of 0.2 cm. Define the random variable X in words. X = ______________.
Solution
diameter of a rubber ball
If X ~ N(–4, 1).
What is the median?
Solution
–4
If X ~ N(3, 5)
σ = _______
Solution
5
If X ~ N(–2, 1)
μ = _______
Solution
–2
What does a z-score measure?
Solution
The number of standard deviations a value is from the mean.
What does standardizing a normal distribution do to the mean?
Solution
The mean becomes zero.
Is X ~ N(0, 1) a standardized normal distribution? Why or why not?
Solution
Yes because the mean is zero, and the standard deviation is one.
What is the z-score of x = 12, if it is two standard deviations to the right of the mean?
Solution
z = 2
What is the z-score of x = 9, if it is 1.5 standard deviations to the left of the mean?
Solution
z = –1.5 –>
What is the z-score of x = –2, if it is 2.78 standard deviations to the right of the mean?
Solution
z = 2.78
What is the z-score of x = 7, if it is 0.133 standard deviations to the left of the mean?
Solution
z = –0.133
Suppose X ~ N(2, 6). What value of x has a z-score of three?
Solution
x = 20
Suppose X ~ N(8, 1). What value of x has a z-score of –2.25?
Solution
x = 5.75
Suppose X ~ N(9, 5). What value of x has a z-score of –0.5?
Solution
x = 6.5
Suppose X ~ N(2, 3). What value of x has a z-score of –0.67?
Solution
x = –0.01
Suppose X ~ N(4, 2). What value of x is 1.5 standard deviations to the left of the mean?
Solution
x = 1
Suppose X ~ N(4, 2). What value of x is two standard deviations to the right of the mean?
Solution
x = 8
Suppose X ~ N(8, 9). What value of x is 0.67 standard deviations to the left of the mean?
Solution
x = 1.97
Suppose X ~ N(–1, 2). What is the z-score of x = 2?
Solution
z = 1.5
Suppose X ~ N(12, 6). What is the z-score of x = 2?
Solution
z = –1.67
Suppose X ~ N(9, 3). What is the z-score of x = 9?
Solution
z = 0
Suppose a normal distribution has a mean of six and a standard deviation of 1.5. What is the z-score of x = 5.5?
Solution
z ≈ –0.33
In a normal distribution, x = 5 and z = –1.25. This tells you that x = 5 is ____ standard deviations to the ____ (right or left) of the mean.
Solution
1.25, left
In a normal distribution, x = 3 and z = 0.67. This tells you that x = 3 is ____ standard deviations to the ____ (right or left) of the mean.
Solution
0.67, right
In a normal distribution, x = –2 and z = 6. This tells you that x = –2 is ____ standard deviations to the ____ (right or left) of the mean.
Solution
six, right
In a normal distribution, x = –5 and z = –3.14. This tells you that x = –5 is ____ standard deviations to the ____ (right or left) of the mean.
Solution
3.14, left
In a normal distribution, x = 6 and z = –1.7. This tells you that x = 6 is ____ standard deviations to the ____ (right or left) of the mean.
Solution
1.7, left
About what percent of x values from a normal distribution lie within one standard deviation (left and right) of the mean of that distribution?
Solution
about 68%
About what percent of the x values from a normal distribution lie within two standard deviations (left and right) of the mean of that distribution?
Solution
about 95.45%
About what percent of x values lie between the second and third standard deviations (both sides)?
Solution
about 4%
Suppose X ~ N(15, 3). Between what x values does 68.27% of the data lie? The range of x values is centered at the mean of the distribution (i.e., 15).
Solution
between 12 and 18
Suppose X ~ N(–3, 1). Between what x values does 95.45% of the data lie? The range of x values is centered at the mean of the distribution(i.e., –3).
Solution
between –5 and –1
Suppose X ~ N(–3, 1). Between what x values does 34.14% of the data lie?
Solution
between –4 and –3 or between –3 and –2
About what percent of x values lie between the mean and three standard deviations?
Solution
about 50%
About what percent of x values lie between the mean and one standard deviation?
Solution
about 34.14%
About what percent of x values lie between the first and second standard deviations from the mean (both sides)?
Solution
about 27%
About what percent of x values lie between the first and third standard deviations(both sides)?
Solution
about 34.46%
Use the following information to answer the next two exercises:
The life of Sunshine CD players is normally distributed with a mean of 4.1 years and a standard deviation of 1.3 years. A CD player is guaranteed for three years. We are interested in the length of time a CD player lasts.
1. Define the random variable X in words. X = _______________.
Solution
The lifetime of a Sunshine CD player measured in years.
2. The distribution is: X ~ _____(_____,_____)
Solution
X ~ N(4.1, 1.3)
Section 6.2 Practice
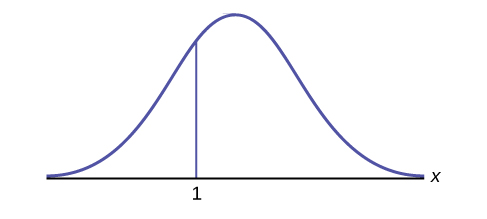
How would you represent the area to the left of one in a probability statement?
Solution
P(x < 1)
What is the area to the right of one?
Solution
1 – P(x < 1) or P(x < 1)
Is P(x < 1) equal to P(x ≤ 1)? Why?
Solution
Yes, because they are the same in a continuous distribution: P(x = 1) = 0
How would you represent the area to the left of three in a probability statement?

Solution
P(x < 3)
What is the area to the right of three?
Solution
1 – P(x < 3) or P(x > 3)
If the area to the left of x in a normal distribution is 0.123, what is the area to the right of x?
Solution
1 – 0.123 = 0.877
If the area to the right of x in a normal distribution is 0.543, what is the area to the left of x?
Solution
1 – 0.543 = 0.457
Use the following information to answer the next four exercises:
X ~ N(54, 8)
1. Find the probability that x > 56.
Solution
0.4013
2. Find the probability that x < 30.
Solution
0.0013
3. Find the 80th percentile.
Solution
60.73
4. Find the 60th percentile.
Solution
56.03
X ~ N(6, 2)
Find the probability that x is between three and nine.
Solution
0.8664
X ~ N(–3, 4)
Find the probability that x is between one and four.
Solution
0.1186
X ~ N(4, 5)
Find the maximum of x in the bottom quartile.
Solution
0.6276
Use the following information to answer the next three exercise:
The life of Sunshine CD players is normally distributed with a mean of 4.1 years and a standard deviation of 1.3 years. A CD player is guaranteed for three years. We are interested in the length of time a CD player lasts.
1. Find the probability that a CD player will break down during the guarantee period.
a. Sketch the situation. Label and scale the axes. Shade the region corresponding to the probability.

b. P(0 < x < ____________) = ___________ (Use zero for the minimum value of x.)
Solution
a. Check student’s solution.
b. 3, 0.1979
2. Find the probability that a CD player will last between 2.8 and six years.
a. Sketch the situation. Label and scale the axes. Shade the region corresponding to the probability.

b. P(__________ < x < __________) = __________
Solution
a. Check student’s solution
b. 2.8, 6, 0.7694
3. Find the 70th percentile of the distribution for the time a CD player lasts.
a. Sketch the situation. Label and scale the axes. Shade the region corresponding to the lower 70%.
b. P(x < k) = __________ Therefore, k = _________
Solution
a. Check student’s solution.
b. 0.70, 4.78 years
Section 6.3 Practice
Use the following information to answer the next six exercises:
Yoonie is a personnel manager in a large corporation. Each month she must review 16 of the employees. From past experience, she has found that the reviews take her approximately four hours each to do with a population standard deviation of 1.2 hours. Let Χ be the random variable representing the time it takes her to complete one review. Assume Χ is normally distributed. Let [latex]\overline{X}[/latex] be the random variable representing the mean time to complete the 16 reviews. Assume that the 16 reviews represent a random set of reviews.
1. What is the mean, standard deviation, and sample size?
Solution
mean = 4 hours; standard deviation = 1.2 hours; sample size = 16
2. Complete the distributions.
Solution
X ~ N(4, 1.2).
3. Find the probability that one review will take Yoonie from 3.5 to 4.25 hours.
a. Sketch the graph, labeling and scaling the horizontal axis. Shade the region corresponding to the probability.
Solution
a. Check student’s solution.
b. 3.5, 4.25, 0.2441
4. Find the probability that the mean of a month’s reviews will take Yoonie from 3.5 to 4.25 hrs.
a. Sketch the graph, labeling and scaling the horizontal axis. Shade the region corresponding to the probability.
Solution
a. Check student’s solution.
b. 0.7499
Solution
The fact that the two distributions are different accounts for the different probabilities.
6. Find the 95th percentile for the mean time to complete one month’s reviews.
a. Sketch the graph.
b. The 95th Percentile =____________
Solution
P(3.5 < [latex]\overline{x}[/latex] < 4.25) = invNorm(95,4,1.216) = 4.49
Section 6.4 Practice
Use the following information to answer the next four exercises:
An unknown distribution has a mean of 80 and a standard deviation of 12. A sample size of 95 is drawn randomly from the population.
1. Find the probability that the sum of the 95 values is greater than 7,650.
Solution
0.3345
2. Find the probability that the sum of the 95 values is less than 7,400.
Solution
0.0436
3. Find the sum that is two standard deviations above the mean of the sums.
Solution
7,833.92
4. Find the sum that is 1.5 standard deviations below the mean of the sums.
Solution
7,424.56
Use the following information to answer the next five exercises:
The distribution of results from a cholesterol test has a mean of 180 and a standard deviation of 20. A sample size of 40 is drawn randomly.
1. Find the probability that the sum of the 40 values is greater than 7,500.
Solution
0.0089
2. Find the probability that the sum of the 40 values is less than 7,000.
Solution
0.0569
3. Find the sum that is one standard deviation above the mean of the sums.
Solution
7,326.49
4. Find the sum that is 1.5 standard deviations below the mean of the sums.
Solution
7,010.26
5. Find the percentage of sums between 1.5 standard deviations below the mean of the sums and one standard deviation above the mean of the sums.
Solution
77.45%
Use the following information to answer the next six exercises:
A researcher measures the amount of sugar in several cans of the same soda. The mean is 39.01 with a standard deviation of 0.5. The researcher randomly selects a sample of 100.
1. Find the probability that the sum of the 100 values is greater than 3,910.
Solution
0.0359
2. Find the probability that the sum of the 100 values is less than 3,900.
Solution
0.4207
3. Find the probability that the sum of the 100 values falls between the numbers you found in [link] and [link].
Solution
0.5433
4. Find the sum with a z–score of –2.5.
Solution
3,888.5
5. Find the sum with a z–score of 0.5.
Solution
3,903.5
6. Find the probability that the sums will fall between the z-scores –2 and 1.
Solution
0.8186
Use the following information to answer the next four exercise:
An unknown distribution has a mean 12 and a standard deviation of one. A sample size of 25 is taken. Let X = the object of interest.
1. What is the mean of ΣX?
Solution
300
2. What is the standard deviation of ΣX?
Solution
5
3. What is P(Σx = 290)?
Solution
0
4. What is P(Σx > 290)?
Solution
0.9772
True or False: Only the sums of normal distributions are also normal distributions.
Solution
False, the sums of any distribution approach a normal distribution as the sample size increases.
In order for the sums of a distribution to approach a normal distribution, what must be true?
Solution
The sample size, n, gets larger.
What three things must you know about a distribution to find the probability of sums?
Solution
the mean of the distribution, the standard deviation of the distribution, and the sample size –>
An unknown distribution has a mean of 25 and a standard deviation of six. Let X = one object from this distribution. What is the sample size if the standard deviation of ΣX is 42?
Solution
49
An unknown distribution has a mean of 19 and a standard deviation of 20. Let X = the object of interest. What is the sample size if the mean of ΣX is 15,200?
Solution
800
Use the following information to answer the next three exercises:
A market researcher analyzes how many electronics devices customers buy in a single purchase. The distribution has a mean of three with a standard deviation of 0.7. She samples 400 customers.
1. What is the z-score for Σx = 840?
Solution
26.00
2. What is the z-score for Σx = 1,186?
Solution
–1
3. What is P(Σx < 1,186)?
Solution
0.1587
Use the following information to answer the next three exercises:
An unknown distribution has a mean of 100, a standard deviation of 100, and a sample size of 100. Let X = one object of interest.
1. What is the mean of ΣX?
Solution
10,000
2. What is the standard deviation of ΣX?
Solution
1,000
3. What is P(Σx > 9,000)?
Solution
0.8413
Section 6.5 Practice
Use the following information to answer the next ten exercises:
A manufacturer produces 25-pound lifting weights. The lowest actual weight is 24 pounds, and the highest is 26 pounds. Each weight is equally likely so the distribution of weights is uniform. A sample of 100 weights is taken.
1. Answer the following:
a. What is the distribution for the weights of one 25-pound lifting weight? What is the mean and standard deviation?
b. What is the distribution for the mean weight of 100 25-pound lifting weights?
c. Find the probability that the mean actual weight for the 100 weights is less than 24.9.
Solution
a. U(24, 26), 25, 0.5774
b. N(25, 0.0577)
c. 0.0416
Solution
3. Find the probability that the mean actual weight for the 100 weights is greater than 25.2.
Solution
0.0003
Solution
5. Find the 90th percentile for the mean weight for the 100 weights.
Solution
25.07
Solution
7. Answer the following:
a. What is the distribution for the sum of the weights of 100 25-pound lifting weights?
b. Find P(Σx < 2,450).
Solution
a. N(2,500, 5.7735)
b. 0
Solution
9. Find the 90th percentile for the total weight of the 100 weights.
Solution
2,507.40
Solution
Use the following information to answer the next eight exercises:
The length of time a particular smartphone’s battery lasts follows an exponential distribution with a mean of ten months. A sample of 64 of these smartphones is taken.
1. Answer the following:
a. What is the standard deviation?
b. What is the parameter m?
Solution
a. 10
b. [latex]\frac{1}{10}[/latex]
2. What is the distribution for the length of time one battery lasts?
Solution
Exp(1/10)
3. What is the distribution for the mean length of time 64 batteries last?
Solution
N[latex]\left(\text{10, }\frac{10}{8}\right)[/latex]
4. What is the distribution for the total length of time 64 batteries last?
Solution
N(640, 80)
5. Find the probability that the sample mean is between seven and 11.
Solution
0.7799
6. Find the 80th percentile for the total length of time 64 batteries last.
Solution
707.3 –>
7. Find the IQR for the mean amount of time 64 batteries last.
Solution
1.69
8. Find the middle 80% for the total amount of time 64 batteries last.
Solution
205.05
Use the following information to answer the next six exercises:
A uniform distribution has a minimum of six and a maximum of ten. A sample of 50 is taken.
1. Find P(Σx > 420).
Solution
0.0072
2. Find the 90th percentile for the sums.
Solution
410.46
3. Find the 15th percentile for the sums.
Solution
391.54
4. Find the first quartile for the sums.
Solution
394.49
5. Find the third quartile for the sums.
Solution
405.51
Find the 80th percentile for the sums.
Solution
406.87
