Chapter 5: Continuous Random Variables
Chapter 5 Practice
5.1 Practice
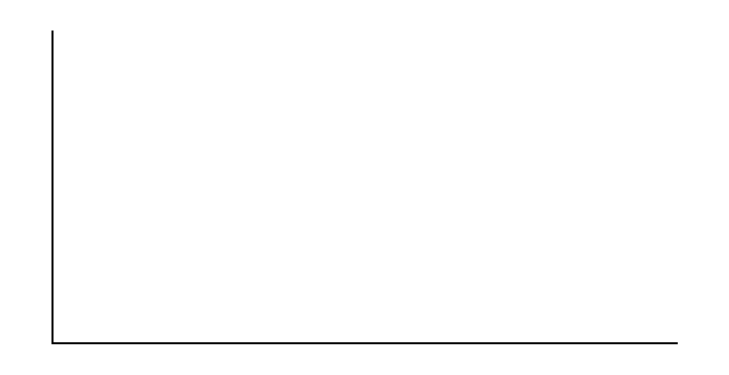
Which type of distribution does the graph illustrate?
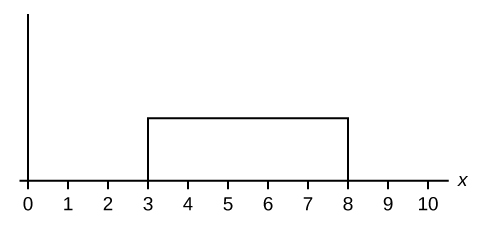
Solution
Uniform Distribution
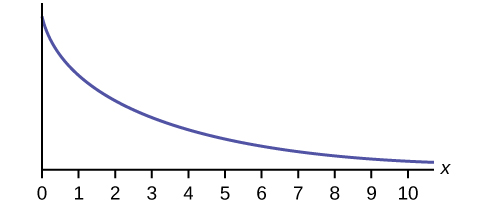
Which type of distribution does the graph illustrate?
Which type of distribution does the graph illustrate?
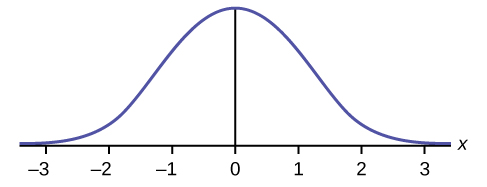
Solution
Normal Distribution
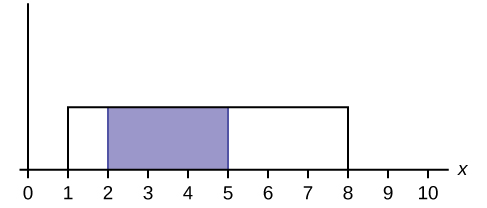
What does the shaded area represent? P(___< x < ___)
What does the shaded area represent? P(___< x < ___)
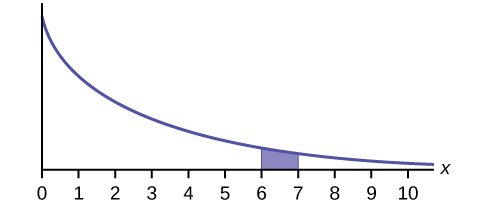
Solution
P(6 < x < 7)
For a continuous probability distribution, 0 ≤ x ≤ 15. What is P(x > 15)?
What is the area under f(x) if the function is a continuous probability density function?
Solution
one
For a continuous probability distribution, 0 ≤ x ≤ 10. What is P(x = 7)?
A continuous probability function is restricted to the portion between x = 0 and 7. What is P(x = 10)?
Solution
zero
f(x) for a continuous probability function is [latex]\frac{1}{5}[/latex], and the function is restricted to 0 ≤ x ≤ 5. What is P(x < 0)?
f(x), a continuous probability function, is equal to [latex]\frac{1}{12}[/latex], and the function is restricted to 0 ≤ x ≤ 12. What is P (0 < x < 12)?
Solution
one
Find the probability that x falls in the shaded area.

Find the probability that x falls in the shaded area.
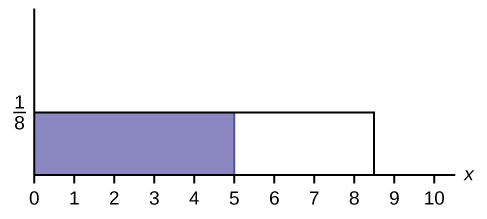
Solution
0.625
Find the probability that x falls in the shaded area.

f(x), a continuous probability function, is equal to [latex]\frac{1}{3}[/latex] and the function is restricted to 1 ≤ x ≤ 4. Describe [latex]P\left(x>\frac{3}{2}\right).[/latex]
Solution
The probability is equal to the area from x = [latex]\frac{3}{2}[/latex] to x = 4 above the x-axis and up to f(x) = [latex]\frac{1}{3}[/latex].
5.2 Practice
McDougall, John A. The McDougall Program for Maximum Weight Loss. Plume, 1995.
Use the following information to answer the next ten questions. The data that follow are the square footage (in 1,000 feet squared) of 28 homes.
| 1.5 | 2.4 | 3.6 | 2.6 | 1.6 | 2.4 | 2.0 |
| 3.5 | 2.5 | 1.8 | 2.4 | 2.5 | 3.5 | 4.0 |
| 2.6 | 1.6 | 2.2 | 1.8 | 3.8 | 2.5 | 1.5 |
| 2.8 | 1.8 | 4.5 | 1.9 | 1.9 | 3.1 | 1.6 |
The sample mean = 2.50 and the sample standard deviation = 0.8302.
The distribution can be written as X ~ U(1.5, 4.5).
What type of distribution is this?
In this distribution, outcomes are equally likely. What does this mean?
Solution
It means that the value of x is just as likely to be any number between 1.5 and 4.5.
References
What is the height of f(x) for the continuous probability distribution?
What are the constraints for the values of x?
Solution
1.5 ≤ x ≤ 4.5
Graph P(2 < x < 3).
What is P(2 < x < 3)?
Solution
0.3333
What is P(x < 3.5| x < 4)?
What is P(x = 1.5)?
Solution
zero
What is the 90th percentile of square footage for homes?
Find the probability that a randomly selected home has more than 3,000 square feet given that you already know the house has more than 2,000 square feet.
Solution
0.6
Use the following information to answer the next eight exercises. A distribution is given as X ~ U(0, 12).
What is a? What does it represent?
What is b? What does it represent?
Solution
b is 12, and it represents the highest value of x.
What is the probability density function?
What is the theoretical mean?
Solution
six
What is the theoretical standard deviation?
Draw the graph of the distribution for P(x > 9).
Solution
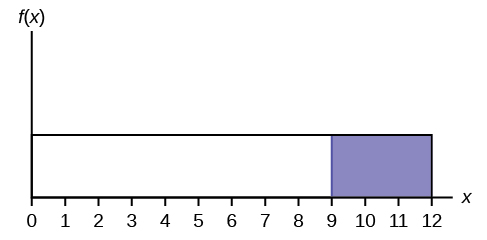
Find P(x > 9).
Find the 40th percentile.
Solution
4.8
Use the following information to answer the next eleven exercises. The age of cars in the staff parking lot of a suburban college is uniformly distributed from six months (0.5 years) to 9.5 years.
What is being measured here?
In words, define the random variable X.
Solution
X = The age (in years) of cars in the staff parking lot
Are the data discrete or continuous?
The interval of values for x is ______.
Solution
0.5 to 9.5
The distribution for X is ______.
Write the probability density function.
Solution
f(x) = [latex]\frac{1}{9}[/latex] where x is between 0.5 and 9.5, inclusive.
Graph the probability distribution.
- Sketch the graph of the probability distribution.
- Identify the following values:
- Lowest value for [latex]\overline{x}[/latex]: _______
- Highest value for [latex]\overline{x}[/latex]: _______
- Height of the rectangle: _______
- Label for x-axis (words): _______
- Label for y-axis (words): _______
Find the average age of the cars in the lot.
Solution
μ = 5
Find the probability that a randomly chosen car in the lot was less than four years old.
- Sketch the graph, and shade the area of interest.
- Find the probability. P(x < 4) = _______
Considering only the cars less than 7.5 years old, find the probability that a randomly chosen car in the lot was less than four years old.
- Sketch the graph, shade the area of interest.
- Find the probability. P(x < 4|x < 7.5) = _______
Solution
- Check student’s solution.
- [latex]\frac{3.5}{7}[/latex]
What has changed in the previous two problems that made the solutions different?
Find the third quartile of ages of cars in the lot. This means you will have to find the value such that [latex]\frac{3}{4}[/latex], or 75%, of the cars are at most (less than or equal to) that age.
- Sketch the graph, and shade the area of interest.
- Find the value k such that P(x < k) = 0.75.
- The third quartile is _______
Solution
- Check student’s solution.
- k = 7.25
- 7.25
5.2 Practice
References
Data from the United States Census Bureau.
Data from World Earthquakes, 2013. Available online at http://www.world-earthquakes.com/ (accessed June 11, 2013).
“No-hitter.” Baseball-Reference.com, 2013. Available online at http://www.baseball-reference.com/bullpen/No-hitter (accessed June 11, 2013).
Zhou, Rick. “Exponential Distribution lecture slides.” Available online at www.public.iastate.edu/~riczw/stat330s11/lecture/lec13.pdf (accessed June 11, 2013).
Use the following information to answer the next ten exercises. A customer service representative must spend different amounts of time with each customer to resolve various concerns. The amount of time spent with each customer can be modeled by the following distribution: X ~ Exp(0.2)
What type of distribution is this?
Are outcomes equally likely in this distribution? Why or why not?
Solution
No, outcomes are not equally likely. In this distribution, more people require a little bit of time, and fewer people require a lot of time, so it is more likely that someone will require less time.
What is m? What does it represent?
What is the mean?
Solution
five
What is the standard deviation?
State the probability density function.
Solution
f(x) = 0.2e-0.2x
Graph the distribution.
Find P(2 < x < 10).
Solution
0.5350
Find P(x > 6).
Find the 70th percentile.
Solution
6.02
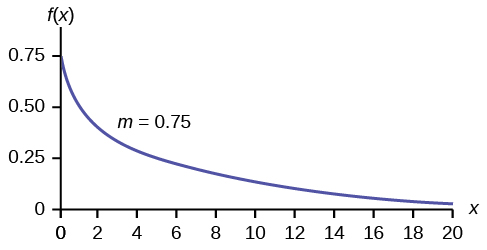
Use the following information to answer the next seven exercises. A distribution is given as X ~ Exp(0.75).
What is m?
What is the probability density function?
Solution
f(x) = 0.75e-0.75x
What is the cumulative distribution function?
Draw the distribution.
Solution
Find P(x < 4).
Find the 30th percentile.
Solution
0.4756
Find the median.
Which is larger, the mean or the median?
Solution
The mean is larger. The mean is [latex]\frac{1}{m}=\frac{1}{0.75}\approx 1.33[/latex], which is greater than 0.9242.
Use the following information to answer the next 16 exercises. Carbon-14 is a radioactive element with a half-life of about 5,730 years. Carbon-14 is said to decay exponentially. The decay rate is 0.000121. We start with one gram of carbon-14. We are interested in the time (years) it takes to decay carbon-14.
What is being measured here?
Are the data discrete or continuous?
Solution
continuous
In words, define the random variable X.
What is the decay rate (m)?
Solution
m = 0.000121
The distribution for X is ______.
Find the amount (percent of one gram) of carbon-14 lasting less than 5,730 years. This means, find P(x < 5,730).
- Sketch the graph, and shade the area of interest.

- Find the probability. P(x < 5,730) = __________
Solution
- Check student’s solution
- P(x < 5,730) = 0.5001
Find the percentage of carbon-14 lasting longer than 10,000 years.
- Sketch the graph, and shade the area of interest.
- Find the probability. P(x > 10,000) = ________
Thirty percent (30%) of carbon-14 will decay within how many years?
- Sketch the graph, and shade the area of interest.
- Find the value k such that P(x < k) = 0.30.
Solution
- Check student’s solution.
- k = 2947.73
